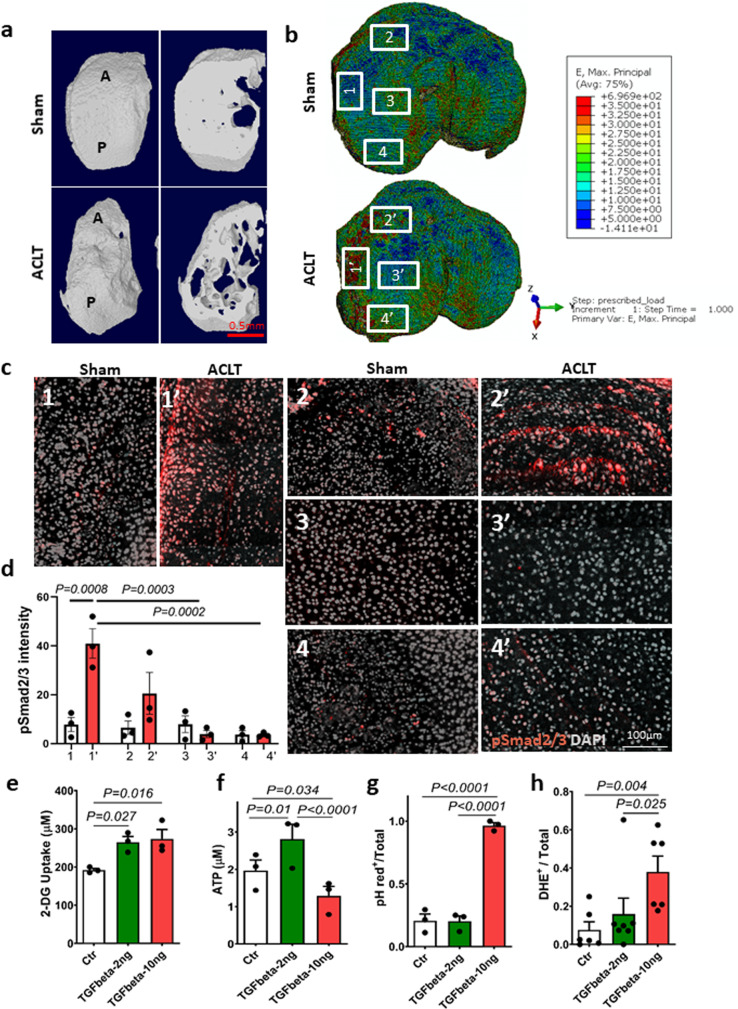
Fig. 2. TGFβ activation pattern in AC was aligned with mechanical stress distribution.
a Representative 3D reconstructed images of the tibia medial compartment from mice 1 month after ACL-T or sham surgery. The left images in each panel: top view; right images in each panel: transaxial view of the tibial plateau sectioned at the same horizontal level. b FEA simulation of the maximum principle strain at the tibia plateau based on the SB structure. The numbered boxes represent the individual areas in c. Source data are provided as a Source data file. c Immunofluorescence images of pSmad2/3 staining in full layer of AC of mouse tibia medial plateau at regions with different mechanical stress. The location of the image was indicated in b, pSmad2/3 (red), DAPI (gray). d Quantitative analysis of pSmad2/3 fluorescent intensity of c. n = 3 biologically independent animals, data were analyzed using two-way ANOVA Tukey’s post hoc test. Data are presented as mean values + /− SEM. e–h SV40 chondrocytes were cultured in low (2 ng/ml) or high (10 ng/ml) concentration of recombinant TGFβ1 for 48 h. n = 3 or 6 independent experiments in e–g or h, respectively. Data were analyzed using one-way ANOVA followed by LSD post hoc test. Data are presented as mean values + /− SEM. Source data are provided as a Source data file for e–g. e Glucose uptake assay using glucose analog 2-deoxyglucose (2-DG) to detect and quantify glucose uptake in chondrocytes. f Detection of total levels of cellular ATP based on the production of light caused by the reaction of ATP with added firefly luciferin. g Quantitative analysis of the ratio of pHrodo+ cells to total chondrocytes of pHrodo fluorescence staining in chondrocytes treated with low or high concentrations of recombinant TGFβ1. h Quantitative analysis of the ratio of DHE-positive cells to total chondrocytes treated with low or high concentration of recombinant TGFβ1.

