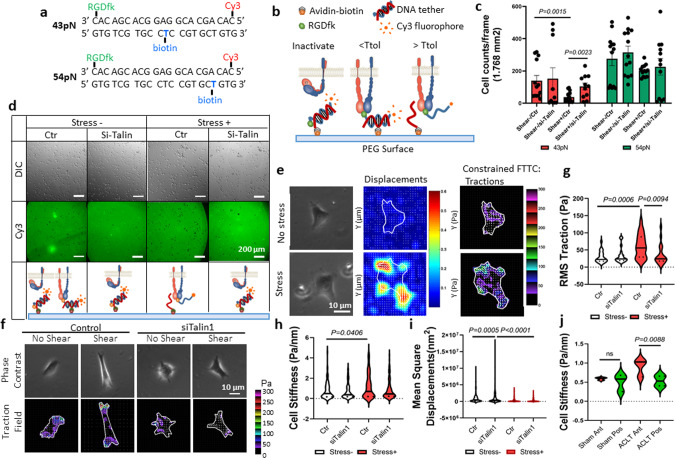
Fig. 5. Talin mediates the strengthening of αV integrin–RGD bond under mechanical stress.
a The sequence of the dsDNA and the conjugation sites of specific molecules. b Schematic illustration of the TGT principle. A dsDNA tether is immobilized on the PEG surface through an avidin–biotin linker. The location of the biotin determines the tension tolerance (Ttol) of the dsDNA. The integrins expressed by the cell bind to the RGDfk conjugated with the dsDNA at one end. The dsDNA ruptures if the tension applied by the cell through the integrin–RGD bond is greater than its Ttol. The Cy3 fluorescence signals and the adhesion of the cells on the PEG surface are maintained if the tension applied by the cell through the integrin–RGD bond is lower than its Ttol. c Cell density represents the rupture of the DNA tether. n = 13–17 independent cells. Data are presented as mean values + /− SEM. Data were analyzed using two-tailed t test. Source data are provided as a Source data file. d Representative differential interference contrast (DIC) images of the SV40 cells on the PEG surface (upper row) and the direct imaging of RGDfK-dsDNA-Cy3 removal on the PEG surface (bottom row). The cells were prechallenged with or without shear stress. The quantitative analysis is shown in c. Ctr cells were treated with control siRNA, Si-Talin cells were treated with talin siRNA. e Representative phase contrast (left column), the displacement of magnetic beads (middle column), and traction map images (right column) of SV40 cells that were preconditioned with or without shear stress. White lines show the cell boundary; colors show the magnitude of the tractions in Pa (see color scale). f Representative phase contrast (upper row) and traction map images (bottom row) of SV40 cells preconditioned with or without shear stress. Ctr cells were treated with control siRNA, Si-Talin cells were treated with talin siRNA. The quantitative analysis results are shown in g–i. g–i Quantitative analysis of RMS traction force (g), cell stiffness (h), and cytoskeleton remodeling (i) based on the displacement of magnetic beads. n = 10 independent experiments. Data were analyzed using two-way ANOVA Turkey’s post hoc tests. Source data are provided as a Source data file. j Quantitative analysis of cell stiffness of primary chondrocytes isolated from AC of mice tibia medial compartment. The mice were sacrificed 1 month after ACL-T or sham surgery. Ant anterior region, Pos posterior region. n = 3 independent animals. Data were analyzed using two-way ANOVA Turkey’s post hoc test. Source data are provided as a Source data file.

