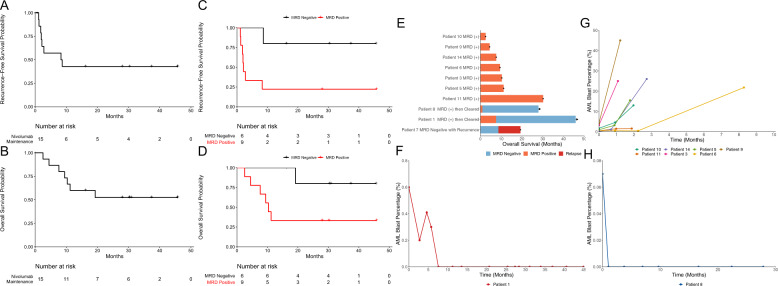
Fig. 1. Survival and MRD Dynamics.
A Kaplan–Meier curve showing recurrence-free survival of the fifteen patients treated with maintenance nivolumab. B Kaplan–Meier curve showing overall survival of the fifteen patients treated with maintenance nivolumab. C Kaplan–Meier curve showing progression-free survival stratified by MRD status at study enrollment. D Kaplan–Meier curve overall survival stratified by MRD status at study enrollment. E Swimmer plot showing overall survival of nine patients with detectable MRD at enrollment along with one patient with undetectable MRD that relapsed. Black dot represents patient death while black arrow represents ongoing MRD negative CR. F MRD dynamics of the remaining seven patient with positive MRD at enrollment that did not clear MRD while on treatment with maintenance nivolumab. G MRD dynamics of patient #1 as measured by flow cytometry while on treatment with maintenance nivolumab. H MRD dynamics of patient #8 as measured by flow cytometry while on treatment with maintenance nivolumab.

