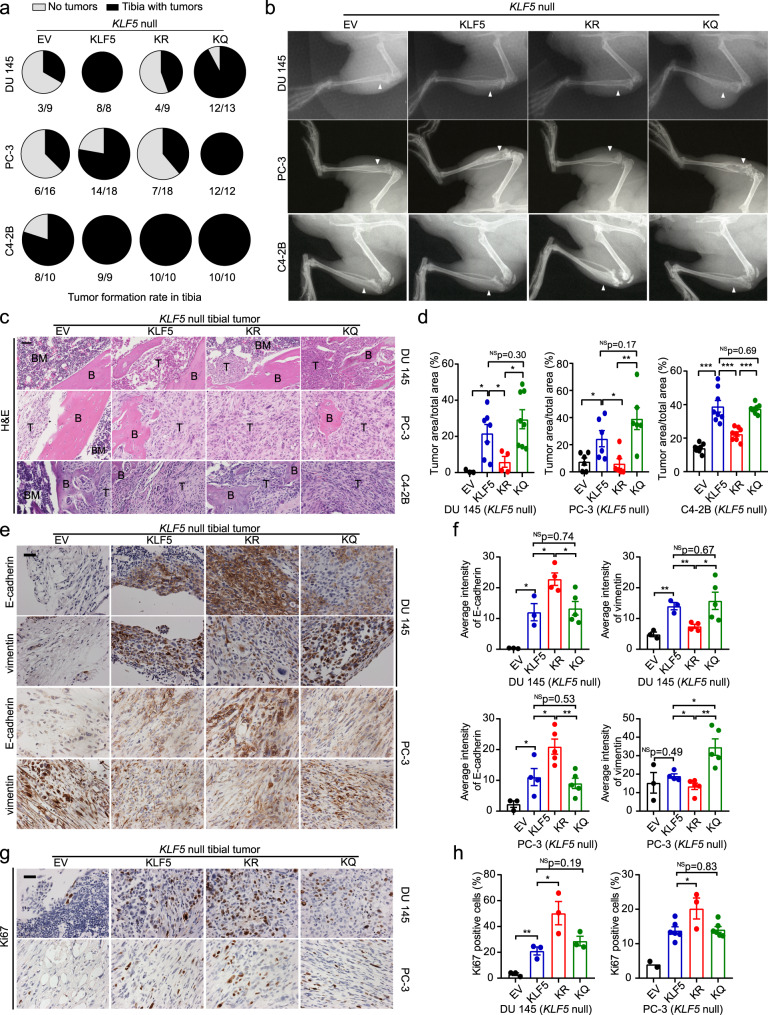
Fig. 2. Acetylation of KLF5 promotes cancer cell-induced bone metastatic lesions while maintaining the mesenchymal phenotype of cancer cells.
a, b Bone metastatic growth of PCa cells (DU 145, PC-3, and C4-2B) expressing different forms of KLF5, including tumor formation rate (a) and radiographs (b) at 5 weeks (DU 145 and PC-3) or 12 weeks (C4-2B) after tibial inoculation of cells. PCa cells with KLF5 knockout (KLF5 null) were infected with lentiviruses to express empty vector (EV), wild-type KLF5 (KLF5), KLF5K369R (KR), and KLF5K369Q (KQ). White arrows point to bone lesion areas. c H&E staining of tibial tumor samples from PCa cells with indicated forms of KLF5. B trabecular bone regions, BM bone marrow regions, T tumor regions. d Statistical analysis of the images in c by calculating the ratio of tumor area to total sample area of DU 145 (left), PC-3 (middle), and C4-2B (right) cells with different forms of KLF5 in bone. For DU 145 cells, n = 3, 7, 4, and 8 tumors for EV, KLF5, KR, and KQ respectively. For PC-3 cells, n = 6 tumors for each group. For C4-2B cells, n = 8 tumors for each group. e, f IHC staining (e) and intensity quantification (f) of epithelial marker E-cadherin and mesenchymal marker vimentin in tibial tumors of DU 145 and PC-3 cells with different forms of KLF5. For DU 145 cells, n = 3, 3, 4, and 5 tumors for EV, KLF5, KR, and KQ respectively. For PC-3 cells, n = 3, 4, 5, and 5 tumors for EV, KLF5, KR, and KQ respectively. g, h IHC staining (g) and signal intensity quantification (h) of proliferation marker Ki67 in tibial tumors of DU 145 (Left) and PC-3 (right) cells. n = 3 tumors for each group of PC-3 cells. For DU 145 cells, n = 2, 6, 3, and 6 tumors for EV, KLF5, KR, and KQ respectively. One representative field per tumor was used for statistical analysis in e–h. Scale bar, 50 μm. In panels d, f, and h, data are shown in mean ± S.E.M. NS not significant; *p < 0.05; **p < 0.01 (two-tailed Student’s t test). The Fiji software was used to quantify staining signal intensities in panels f and h. Source data are provided as a Source Data file.

