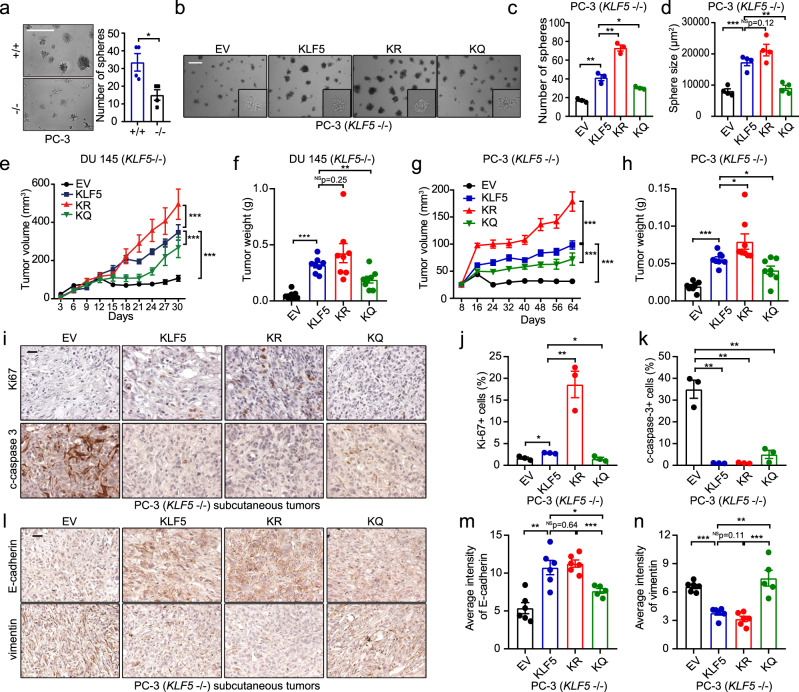
Fig. 3. KLF5 is essential for subcutaneous tumor growth, but KLF5KQ is weaker while KLF5KR is stronger than KLF5 in their tumorigenic activities.
a Deletion of KLF5 inhibited sphere formation in PC-3 cells. +/+, KLF5 wildtype; −/−, KLF5 null. Numbers of spheres in four different wells were analyzed. b–d Expression of wild-type KLF5 (KLF5), KLF5KR (KR), or KLF5KQ (KQ) rescued sphere formation but with different efficiencies, as indicated by representative images (b), numbers (c), and sizes (d) of spheres. EV empty vector. Scale bars in a and b, 500 μm. Three different wells were analyzed for sphere numbers in c, and four randomly selected spheres were used for analyzing size in d for each condition. e–h Subcutaneous tumor growth of DU 145 (e, f) and PC-3 (g, h) cells with different forms of KLF5, as indicated by tumor volumes at different times (e, g) and tumor weights at excision (f, h). Each group had eight tumors. i–k Detection of Ki67 and cleaved caspase 3 by IHC staining (i) and quantitative analyses of Ki67 (j) and cleaved caspase 3 (c-caspase-3) (k) positive rates in tumor xenografts of PC-3 cells. n = 3 tumors for each group. l–n IHC staining (l) and quantification of average staining intensities (m, n) of epithelial markers E-cadherin and mesenchymal marker vimentin in PC-3 tumor xenografts. n = 6 tumors for EV, KLF5, and KR groups and n = 5 tumors for the KQ group. IHC staining intensities were quantified with the Fiji software. Scale bars in i and l, 50 μm. In panels c, d, f, h, j, k, m, n, data are shown in mean ± S.E.M. NS not significant; *p < 0.05; **p < 0.01; ***p < 0.001 (two-tailed Student’s t test). In panels e and g, ***p < 0.001 (two-way ANOVA tests). Source data are provided as a Source Data file.

