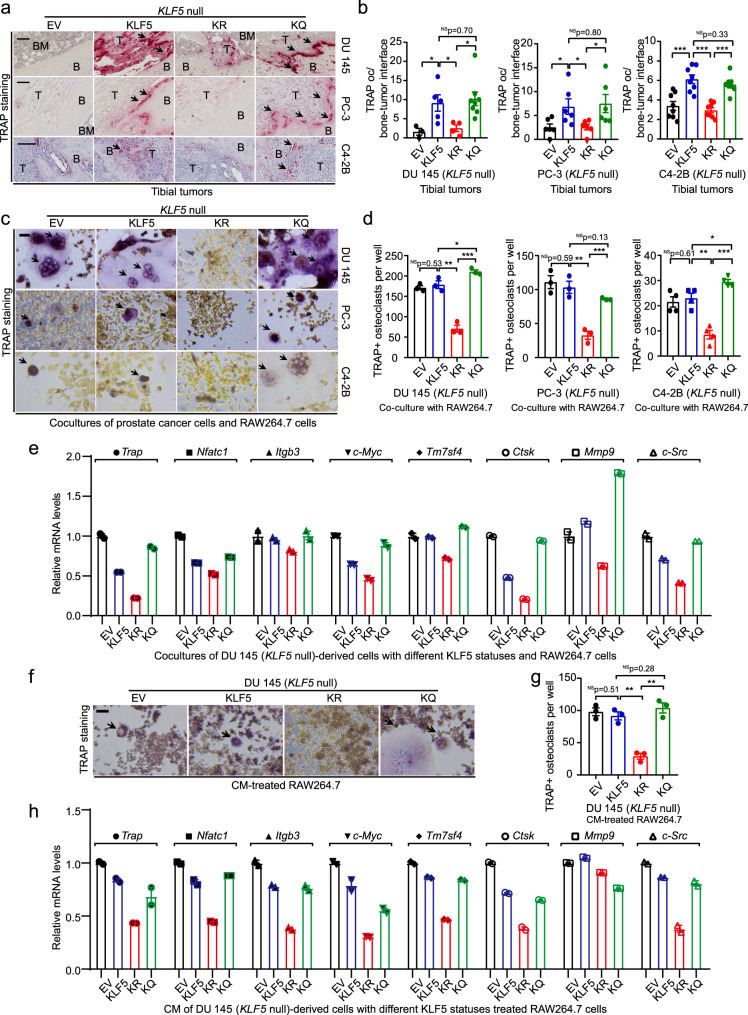
Fig. 4. Acetylation of KLF5 in PCa cells promotes osteoclast differentiation.
a, b Staining of TRAP (a) and TRAP occurrence rates at the bone-tumor interface of bone samples bearing DU 145 (b, left), PC-3 (b, middle), and C4-2B (b, right) cancer cells with different acetylation statuses of KLF5. Black arrows in panel a indicate TRAP occurrence at the interface of bone and tumor areas (marked by B and T respectively). Scale bar in a, 100 μm. For DU 145 tibial tumors, EV, KLF5, KLF5KR (KR), and KLF5KQ (KQ) had 3, 5, 4, and 8 tumors respectively. For PC-3 tibial tumors, each group had six tumors. For C4-2B cells, n = 8 tumors for each group. c, d Differentiation of preosteoclast RAW264.7 cells into TRAP-positive osteoclasts after co-culturing with DU 145 (d, left), PC-3 (d, middle), and C4-2B (d, right) cells with different statuses of KLF5 acetylation, as indicated by TRAP staining (c, TRAP + multinucleated osteoclasts are marked by black arrows) and statistical analyses of TRAP + osteoclasts per well (d). n = 3 wells for each group in DU 145 and PC-3 cells. n = 4 wells for each group in C4-2B cells. e Expression of markers for osteoclast differentiation, including Trap, Nfatc1, Itgb3, c-Myc, Tm7sf4, Ctsk, Mmp9, and c-Src, by real-time qPCR using mouse-specific primers in the co-cultures of RAW264.7 mouse pre-osteoclasts and DU 145 cells with different forms of KLF5. f, g Staining of TRAP (f) and statistical analysis of TRAP + osteoclasts per well (g) in RAW264.7 pre-osteoclasts treated with CM from DU 145 cells with different forms of KLF5 for 6 days. Black arrows in f indicate TRAP + multinucleated osteoclast cells, and n = 3 wells for each group in g. h Detection of osteoclast differentiation markers in CM-treated RAW264.7 pre-osteoclasts by real-time qPCR. For both co-culture and CM treatment experiments, Rankl (20 ng/ml) was added to maintain a basal level of osteoclastogenesis. Scale bars in c and f, 50 μm. In panels b, d and g, data are shown in mean ± S.E.M. NS not significant; *p < 0.05; **p < 0.01; ***p < 0.001 (two-tailed Student’s t test). Source data are provided as a Source Data file.

