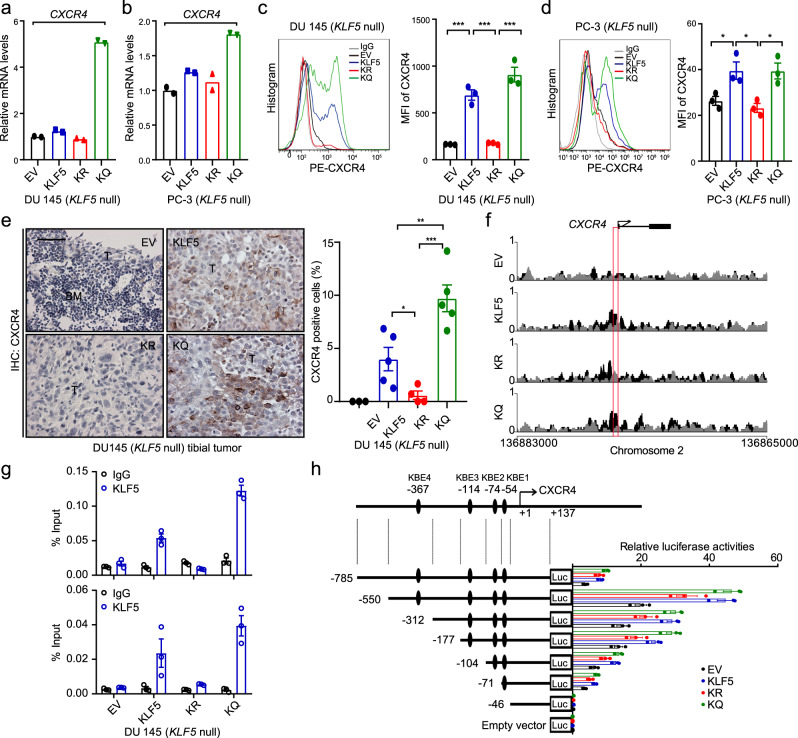
Fig. 6. Acetylation of KLF5 activates the transcription of CXCR4 in PCa cells.
a–d Expression of CXCR4, as detected by real-time qPCR (a, b) and flow cytometry (c, d), in DU 145 cells (a, c) and PC-3 cells (b, d) expressing different forms of KLF5 in in vitro 2-dimentiomal cultures. MFI mean fluorescent intensity. Experiments were performed in duplicate for real-time qPCR (a, b) and in triplicate for flow cytometry (c, d). See more details of panels c and d in Supplementary Fig. 8a. e IHC staining of CXCR4 in tumor-bearing bone samples. Rates of CXCR4-positive cells are shown at the right. BM bone marrow region, T tumor region. Scale bar, 50 μm. n = 3, 5, 4, and 5 tumors for EV, KLF5, KR, and KQ groups respectively. f, g A region in the CXCR4 promoter, indicated by a red box, is specifically bound by KLF5KQ (KQ) but not by KLF5KR (KR), as demonstrated by ChIP-Seq analysis (f) and validated by ChIP-PCR with two different pairs of primers targeting the region (g). ChIP-PCR was performed in triplicate using in vitro two-dimentiomal cultures. h KQ is more potent than KR in the activation of CXCR4 promoter, as revealed by promoter-luciferase reporter assay of different CXCR4 promoter regions. Black ellipse, putative KLF5 binding motifs (KB) predicted by the oPROF web-based software. +1, transcription start site. Promoter-luciferase reporter assay was performed in triplicate. In panels c–e, data are shown in mean ± S.E.M. *p < 0.05; **p < 0.01; ***p < 0.001 (two-tailed Student’s t test). Source data are provided as a Source Data file.

