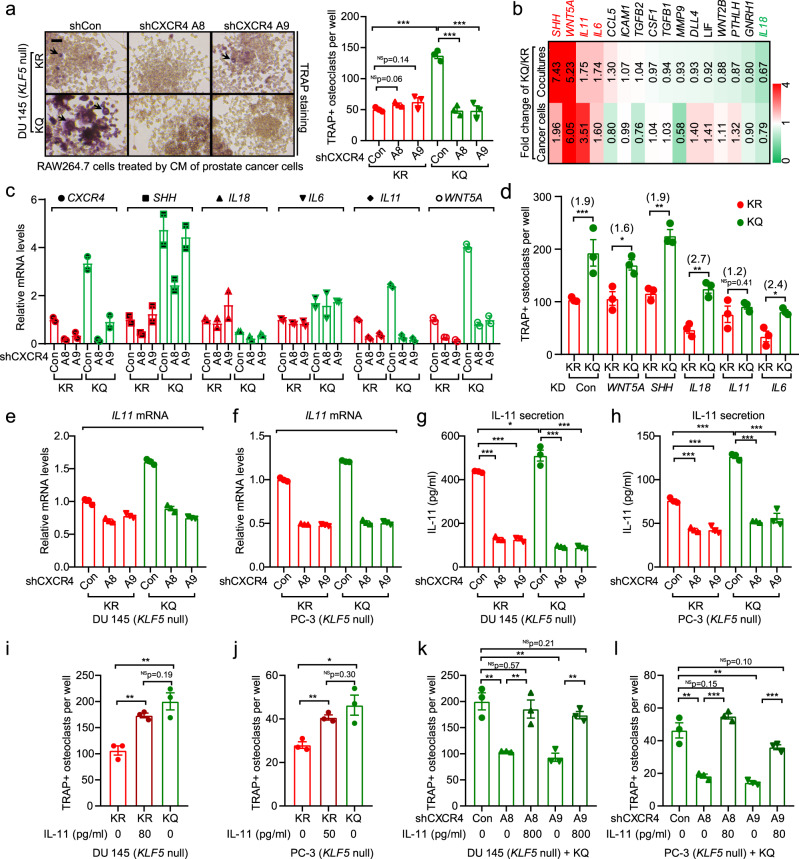
Fig. 7. Acetylation of KLF5 activates CXCR4 to promote osteoclastogenesis by increasing IL-11 secretion.
a Knockdown of CXCR4 attenuates KLF5KQ-induced osteoclastogenesis via paracrine signaling. Preosteoclast RAW264.7 cells were treated with CM from KLF5KR (KR)- or KLF5KQ (KQ)-expressing DU 145 cells with or without CXCR4 knockdown, and TRAP was stained to indicate osteoclast differentiation. A8 and A9 are two different CXCR4 shRNAs. Scale bar, 100 μm. Black arrows indicate TRAP + multinucleated osteoclasts. n = 3 wells for statistical analysis. b Screening for paracrine factors upregulated by KQ but not by KR using real-time qPCR in either KQ/KR-expressing DU 145 cells or their co-cultures with RAW264.7 cells. Each rectangle is colored and the intensity is defined by the fold change of the gene expression levels in KQ versus KR cells. Red and green indicate upregulation and downregulation, respectively. c Expression changes of IL11 but not the other 4 KQ-regulated cytokines, including SHH, IL18, IL6, and Wnt5A respond to CXCR4 knockdown, as revealed by real-time qPCR in co-cultures of KQ- or KR-expressing DU 145 cells with RAW264.7 pre-osteoclasts. d Knockdown of IL11 but not the other four KQ-upregulated cytokines attenuated osteoclastogenesis promoted by KQ, as indicated by TRAP staining in co-cultures of RAW264.7 cells and KQ- or KR-expressing PCa cells with the knockdown of different cytokines. PLKO.1 is the empty vector control for knockdown. Numbers in parentheses indicate fold changes in TRAP + osteoclasts between KQ and KR groups. n = 3 wells per group for statistical analysis. e–h Detection of IL-11 expression by real-time qPCR (e, f) and ELISA (g, h) in KR- or KQ-expressing DU 145 (e, g) and PC-3 (f, h) cells with or without CXCR4 knockdown. Experiments were performed in triplicate. i, j Addition of IL-11 rescued the decrease in osteoclast differentiation of RAW264.7 cells by the CM from DU 145 (i) and PC-3 (j) cells that express KR. k, l Addition of IL-11 rescued the decrease in osteoclast differentiation of RAW264.7 cells by the CM from DU 145 (k) and PC-3 (l) cells that express KQ with the knockdown of CXCR4. n = 3 wells for statistical analysis. In panels a, d, g–l, data are shown in mean ± S.E.M. NS not significant; *p < 0.05; **p < 0.01; ***p < 0.001 (two-tailed Student’s t test). Source data are provided as a Source Data file.

