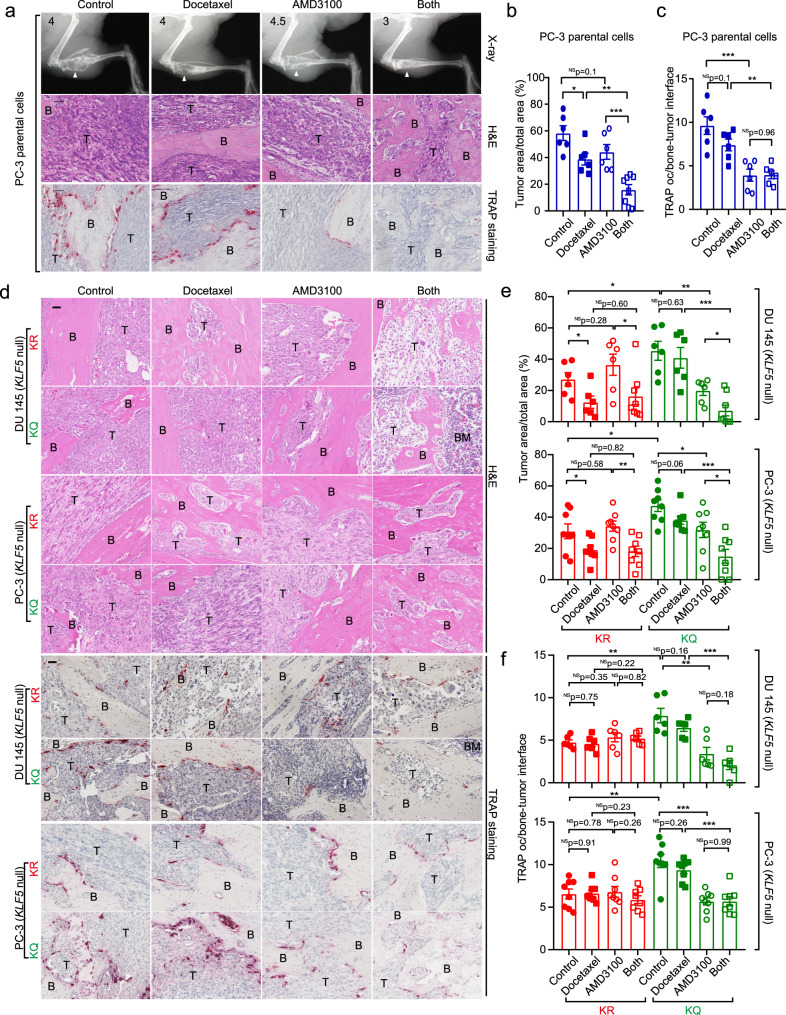
Fig. 8. Inhibition of CXCR4 enhances the therapeutic effect of docetaxel on Ac-KLF5-induced bone metastatic lesions.
a X-ray radiographs (up), H&E staining (middle), and TRAP staining (down) of tibias at 40 days after inoculation of PC-3 parental cells into the tibias. White arrows point to areas of bone lesions. Numbers at the top-left corner of X-ray radiographs are the Average Bone Lesion Score (ABLS) based on the degree of osteolysis. b The ratio of tumor area to total sample area of PC-3 parental cells in tibias under docetaxel and/or AMD3100 treatment. n = 6 tumors for the control or single treatment group and n = 8 tumors for the combined treatment group. c Statistical analyses of TRAP occurrence (oc) at the bone-tumor interface in bone samples bearing PC-3 parental cells treated with docetaxel and/or AMD3100. n = 6 tumors per group. d H&E staining (upper) and TRAP staining (lower) of tibias at 38 days (DU 145) or 43 days (PC-3) after inoculation of cells expressing KLF5KR (KR) or KLF5KQ (KQ). e The ratio of tumor area to total sample area of DU 145 (upper) and PC-3 (lower) cells expressing KLF5KR (KR) or KLF5KQ (KQ) in tibias under the treatments of docetaxel and/or AMD3100. For DU 145, n = 6 tumors for the control or single treatment group and n = 8 tumors for the combined treatment group. For PC-3, n = 8 tumors for each group. f Statistical analyses of TRAP occurrence (oc) at the bone-tumor interface in bone samples bearing DU 145 (up) and PC-3 (down) cells expressing different forms of KLF5 treated with docetaxel and/or AMD3100. For DU 145, n = 6 tumors per group. For PC-3, n = 8 tumors per group. B trabecular bone region, BM bone marrow region, T tumor region. Scale bar, 50 μm. Treatments with docetaxel (10 mg/kg twice a week via i.p.) and/or AMD3100 (3.5 mg/kg/day via i.p.) started at day 11 after tumor inoculation. Representative images shown in a and d are statistically analyzed in b, c and e, f, respectively. In panels b, c, e and f, data are shown in mean ± S.E.M. NS not significant; *p < 0.05; **p < 0.01; ***p < 0.001 (two-tailed Student’s t test). Source data are provided as a Source Data file.

