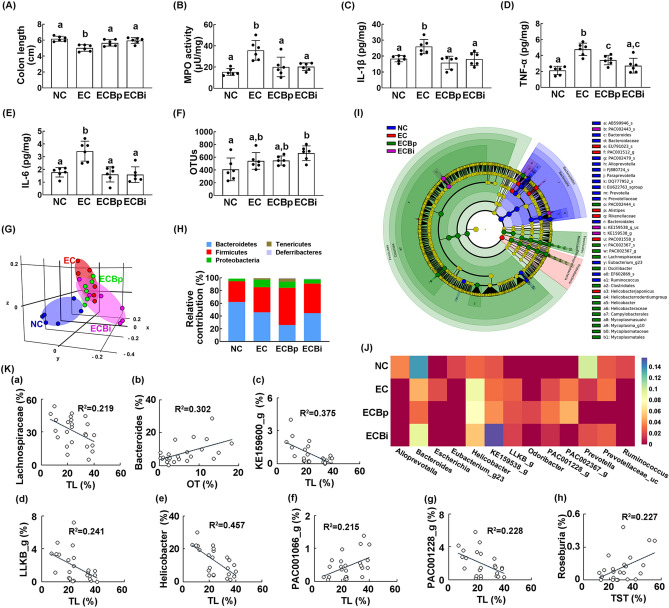
Figure 4.
Orally gavage or intraperitoneal injection of buspirone alleviated Escherichia coli (EC)-induced colitis and gut microbiota pertubation in mice. Effects on IS-induced colon shortening (A), myeloperoxidase (MPO) activity (B), and IL-1β (C) and TNF-α (D) expression (E) in the colon. Effects on the composition of gut microbiota: OTUs (F), and principal coordinate analysis (PCoA) plot based on generalized UniFrac analysis (G). Composition of gut miciobiota were analyzed in phylum level (H). Cladogram was generated by LEfSE indicating (I) significant differences in gut microbial abundances among normal control (NC, blue), EC-treated (EC, red), orally buspirone-treated (ECBp, green), and intraperitoneally buspirone-treated (ECBi, purple) groups. (J) Effects on gut microbiota composition at the genus level, expressed as heat map. (K) The correlation between gut microbiota composition (a, family level; b–h, genus level) and anxiety-/depression-like behaviors, assessed in the EPM (time spent in the open arm [OT]), LDT (time spent in the light box [TL]), and TST (immobility time). Buspirone was orally gavaged (ECBp, 5 mg/kg/day) or intraperitoneally injected (ECBi, 1 mg/kg/day) daily for 5 days from the next day after the final exposure to EC. NC and NC (normal control mice) were orally treated with vehicle (saline) instead of buspirone. (G) and (J) were created in the free Plotly Make Chart program (https://chart-studio.plotly.com/create/#/). (I) was created by using LEfSe analysis tool from the galaxy site (https://huttenhower.sph.harvard.edu/galaxy/). Data values were indicated as mean ± SD (n = 6). Same letters are not significantly different (p < 0.05).

