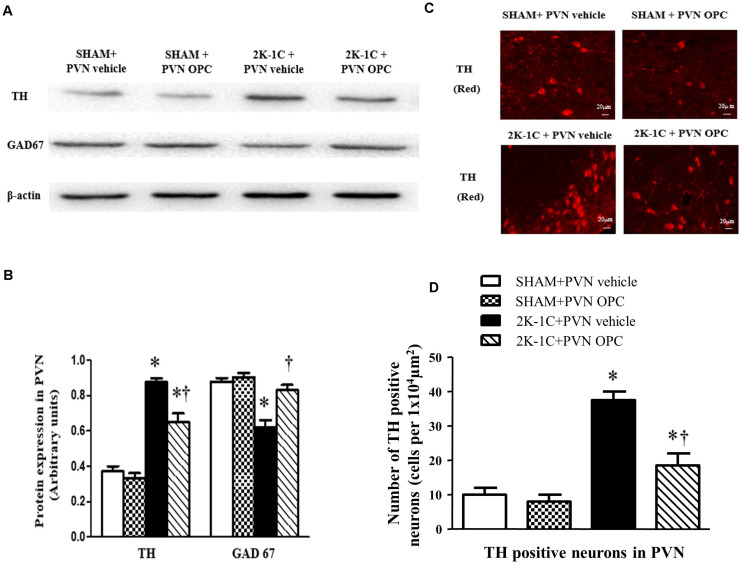
FIGURE 9.
Effects of PVN infusion of OPC on expression of TH and GAD67 in the PVN. (A) Western blotting results of TH and GAD67 expressions in the PVN; (B) Statistical results of TH and GAD67 expression in the PVN; (C) Immunofluorescence staining of TH (red fluorescence) in the PVN; (D) the number of TH positive neurons per 1 × 104 μm2. Data are normalized to β-actin and shown as mean ± SEM. ∗P < 0.05 versus control group (SHAM + PVN aCSF or SHAM + PVN OPC); †P < 0.05 versus 2K-1C + PVN aCSF. n = 6 per group.

