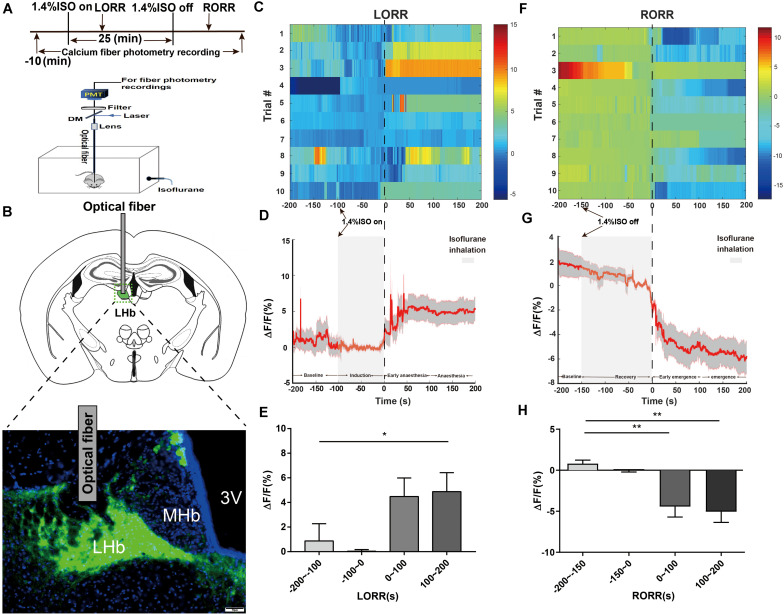
FIGURE 1.
Phase-dependent calcium alterations in LHb glutamatergic neurons during isoflurane anesthesia. (A) Top: Timeline for quantifying the LORR and RORR with isoflurane. Bottom: Schematic diagram depicting fiber photometry recording during isoflurane anesthesia in freely moving mice. (B) Schematic of establishing calcium signal recording model into the LHb in Vglut2-Cre mice, and representative image of the LHb expressing GCaMP6s and optical fiber implanting sites (scale bar = 50 μm). (C) Fluorescence calcium signals aligned to isoflurane-induced loss of righting reflex [LORR were represented the moment of 0, each row plots one trial and a total of 10 trials are illustrated. Color scale at the right represents the value of ΔF/F(%)]. (D) Mean (red trace) ± SEM (gray shading) indicating the average calcium transients during isoflurane induced LORR (n = 10). (E) The fluorescence calcium signals increased after isoflurane-induced unconsciousness [The baseline (wake: –200 to –100 s) vs anesthesia period (100 to 200 s), P = 0.0475, n = 10, Dunnett’s multiple comparisons test after one-way ANOVA]. (F) Fluorescence calcium signals aligned to isoflurane-induced recovery of righting reflex [RORR were represented the moment of 0, each row plots one trial and a total of 10 trials are illustrated. Color scale at the right represents the value of ΔF/F (%)]. (G) Mean (red trace) ± SEM (gray shading) showing the transients of average calcium signals during isoflurane-induced RORR (n = 10). (H) The fluorescence calcium signals sharply decreased during the transition from isoflurane-induced anesthesia to arousal [The baseline (anesthesia: –200 to –150 s) vs early emergence period (0 to 100 s); P = 0.0055; The baseline: (anesthesia: –200 to –150s) vs emergence period (100 to 200 s), P = 0.0026; assessed by one-way ANOVA with Dunnett’s multiple comparisons test; n = 10, *P < 0.05, **P < 0.01].

