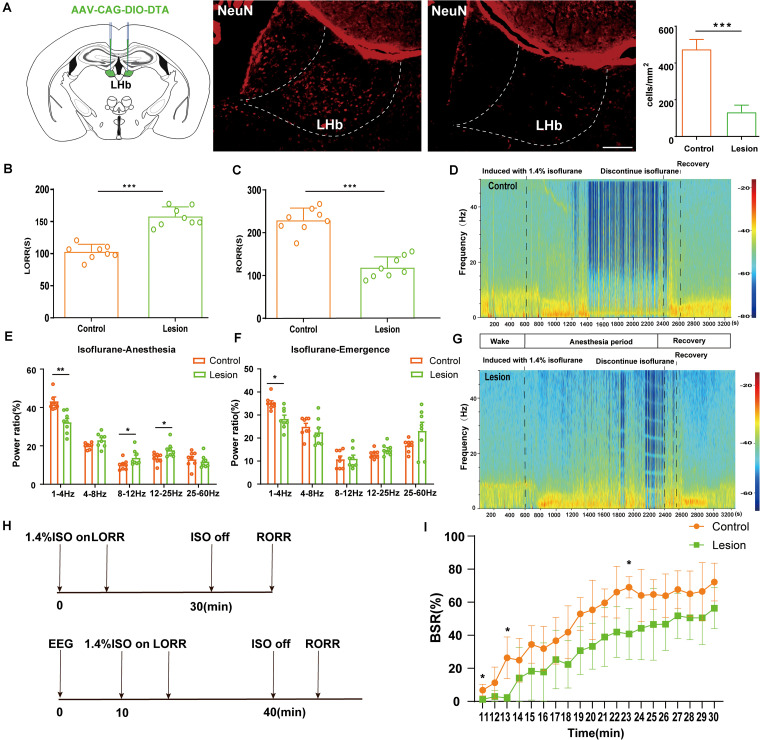
FIGURE 2.
Bilateral lesion of LHb glutamatergic neurons on LORR and RORR time of isoflurane anesthesia. (A) Schematic representation of bilateral AAV injections into the LHb. Image showing NeuN (neuron-specific nuclear protein) staining from a mouse with specific LHb lesion using AAV-CAG-DIO-DTA (scale bar, 100 μm). The lesion group animals were selectively ablated LHb glutamatergic neurons. (B) Induction time and (C) recovery time in the lesion and sham groups (LORR: control group vs lesion group, n = 8; P = 0.000001 by independent-samples t-test; RORR: control group vs lesion group, n = 8; P = 0.00001 by independent-samples t-test n = 8 per group). (D) Spectrograms of EEG power during the isoflurane anesthesia period in the control group. (E) In the isoflurane anesthesia period, the power ratios of the δ band (1–4 Hz), α band (8–12 Hz) and β (12–25 Hz) in the lesion group were significantly changed (δ band: lesion group vs control group; P = 0.002 by independent-samples t-test; α band: lesion group vs control group; P = 0.045 by independent-samples t-test; β band: lesion group vs control group; P = 0.020 by independent-samples t-test, n = 8 per group). (F) Lesion of LHb glutamatergic neurons displaying a significant decrease in the δ band (1–4 Hz) between the two groups (lesion group vs control group; P = 0.03 by independent-samples t-test). (G) Spectrograms of EEG power during the isoflurane anaesthesia period in the lesion group. (H) Protocol for behavioral and electroencephalogram (EEG) recording of induction and emergence times. (I) BSR at 20 min before cessation of isoflurane in M3-NS or M3-CNO. BSR is plotted at each minute (n = 8), using two-way analysis of variance (ANOVA) followed by post hoc Bonferroni’s multiple comparisons: F(1, 14) = 15.06, P = 0.0017 (n = 8 per group; mean ± SD; *P < 0.05, **P < 0.01, and ***P < 0.001).

