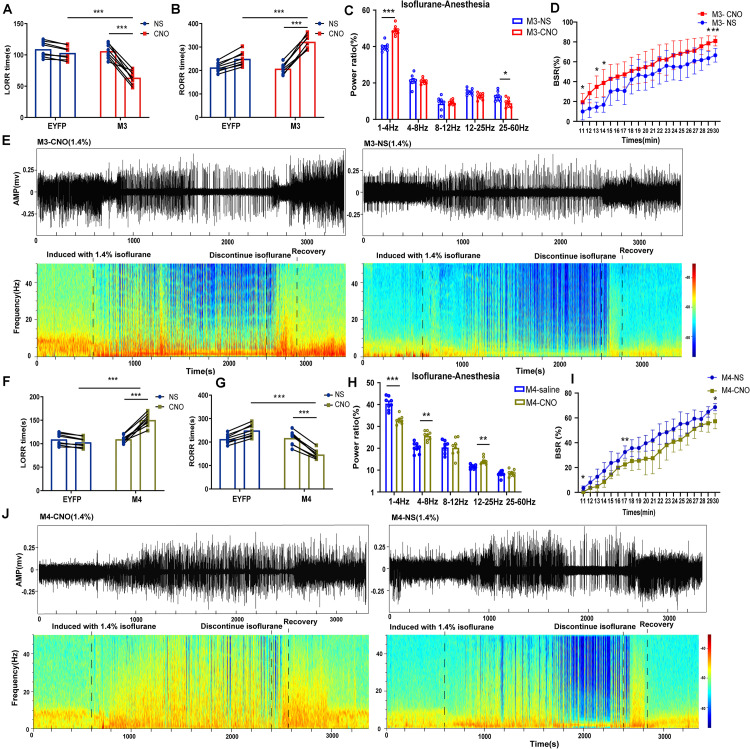
FIGURE 4.
Chemogenetic manipulation of LHb glutamatergic neurons changed induction and arousal from isoflurane. (A) Chemogenetic activation of LHb glutamatergic neurons shortened loss of righting reflex (LORR) time from 1.4% isoflurane anesthesia. (M3-NS vs M3-CNO, P = 0.000046, paired t-test; Control-CNO vs. hM3Dq-CNO, P = 0.000003, independent-simples t-test; n = 8 per group). (B) Chemogenetic activation of LHb glutamatergic neurons prolonged the recovery of righting reflex (RORR) time from 1.4% isoflurane anesthesia (M3-NS vs M3-CNO, P = 0.000002, paired t-test; EYFP-CNO vs M3-CNO, P = 0.000253, independent-simples t-test; n = 8per group). (C) The power distribution of EEG frequency bands in M3-NS or M3-CNO group under 1.4% isoflurane anesthesia; (δ band: P = 0.000044, paired t-test; α band: P = 0.011, paired t-test). (D) BSR at 20 min before cessation of isoflurane in M3-NS or M3-CNO. BSR is plotted at each minute (n = 8), using two-way analysis of variance (ANOVA) followed by post hoc Bonferroni’s multiple comparisons: F(1, 14) = 8.406, P = 0.0117. (E) Representative EEG waveforms and spectrograms EEG power of M3-CNO and M3-NS under 1.4% isoflurane anesthesia. (F) Chemogenetic inactivation of LHb glutamatergic neurons prolonged the induction time from 1.4% isoflurane anesthesia (M4-NS vs M4-CNO, P = 0.000052, paired t-test; EYFP-CNO vs M4-CNO, P = 0.000002, independent-simples t-test). (G) Chemogenetic inactivation of LHb glutamatergic neurons shortened the recovery time from 1.4% isoflurane anesthesia (M4-NS vs M4-CNO, P = 0.000014, paired t-test; EYFP-CNO vs M4-CNO, P = 0.000003, independent-simples t-test). (H) The power distribution of EEG frequency bands during chemogenetic inactivation of LHb glutamatergic neurons under 1.4% isoflurane anesthesia (M4-NS vs M4-CNO: δ band, P = 0.000312, paired t-test; θ band, P = 0.01, paired t-test; β band, P = 0.01, paired t-test). (I) BSR at 20 min before cessation of isoflurane in M4-NS or M4-CNO. BSR is plotted at each minute (n = 8), using two-way analysis of variance (ANOVA) followed by post hoc Bonferroni’s multiple comparisons: F(1, 14) = 11.66, P = 0.0042. (J) Representative EEG waveforms and spectrograms EEG power of M4-CNO and M4-NS under 1.4% isoflurane anesthesia (*P < 0.05; **P < 0.01; ***P < 0.001; n = 8 per group).

