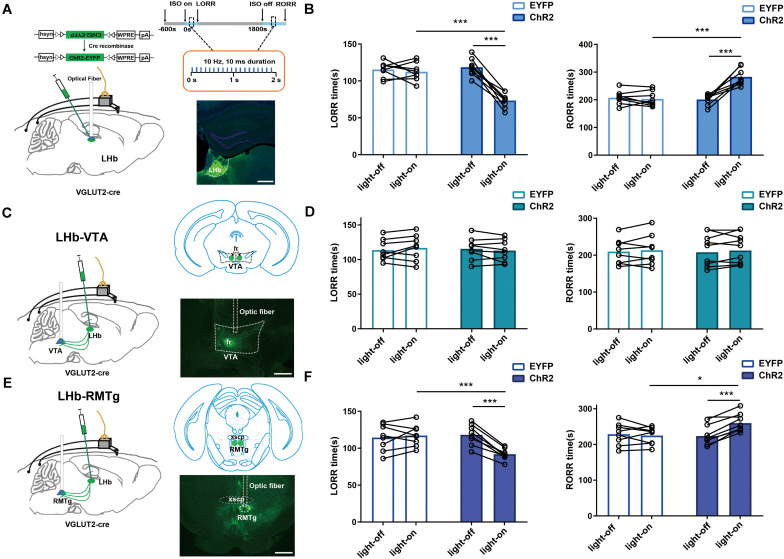
FIGURE 5.
LHb glutamatergic neurons modulated isoflurane anesthesia through the LHb-RMTg pathway. (A) Left: Schematic of optogenetic stimulation of ChR2-expressing LHb glutamatergic neurons with EEG recordings; Right: Protocol for optogenetic activation during isoflurane anesthesia (Top). Image of ChR2-expressing LHb glutamatergic neurons (Bottom, scale bar, 400 μm). (B) Optical activation of LHb glutamatergic neurons shortened induction time (LORR: EYFP-light-on vs ChR2-light-on, P = 0.000008, independent-simples t-test; ChR2-light-on vs ChR2-light-off, P = 0.000043, paired t-test) and prolonged emergence time from 1.4% isoflurane anesthesia (RORR: EYFP-light-on vs ChR2-light-on, P = 0.000363, independent-simples t-test; ChR2-light-on vs ChR2-light-off, P = 0.000074, paired t-test). (C) Schematic of optogenetic stimulation of ChR2-expressing glutamatergic terminals in the ventral tegmental area (VTA) with EEG recordings (left); image of ChR2 expression in the VTA (right, scale bar, 400 μm). (D) Optical stimulation of glutamatergic terminals in the VTA had no impact on the induction and emergence time during isoflurane anesthesia. (E) Schematic of optogenetic stimulation of ChR2-expressing glutamatergic terminals in the rostromedial tegmental nucleus (RMTg) with EEG recordings (left); image of ChR2 expression in the RMTg (right, scale bar, 400 μm). (F) Optical activation of glutamatergic terminals in the RMTg accelerated the induction (LORR: EYFP-light-on vs ChR2-light-on, P = 0.000154, independent-simples t-test; ChR2-light-on vs ChR2-light-off, P = 0.000049, paired t-test) and slacked the emergence from 1.4% isoflurane anesthesia (RORR: EYFP-light-on vs ChR2-light-on, P = 0.0218, independent-simples t-test; ChR2-light-on vs ChR2-light-off, P = 0.0007, paired t-test; *P < 0.05; ***P < 0.001; n = 8 per group).

