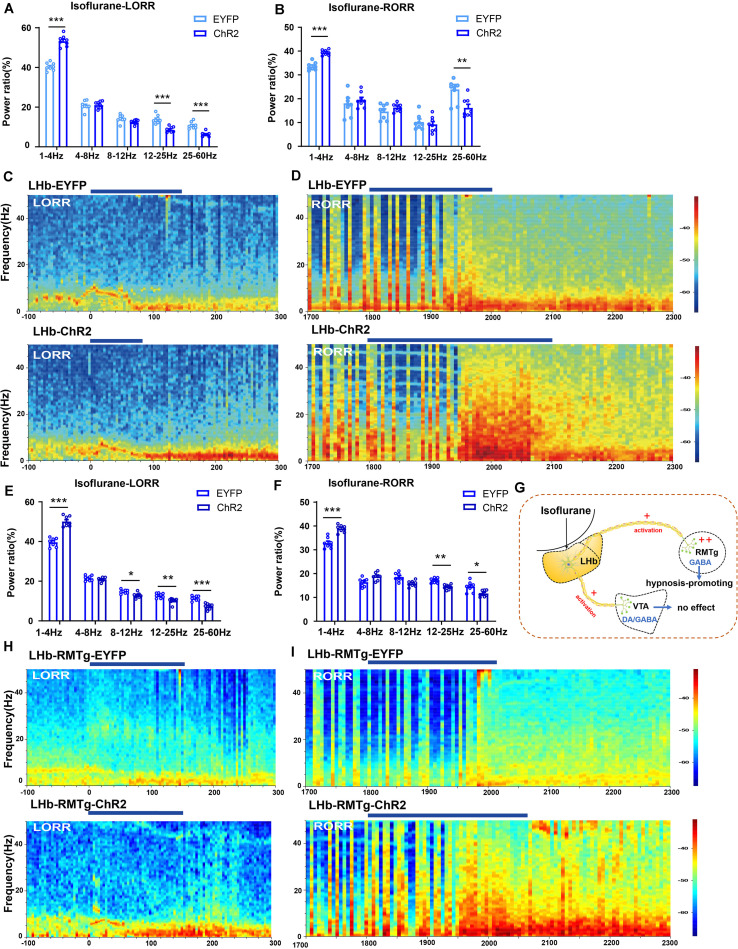
FIGURE 6.
Optical activation of LHb glutamatergic neurons or the LHb-RMTg pathway affected the cortical EEG. (A) Optical activation of LHb glutamatergic neurons changed the cortical EEG during induction (EYFP-light-on vs ChR2-light-on, δ band: P = 0.0002, independent-simples t-test; β band: P = 0.00043, independent-simples t-test; γ band: P = 0.000161, independent-simples t-test). (B) Power percentage changes in cortical EEG during arousal from isoflurane with (EYFP-light-on vs ChR2-light-on, δ band: P = 0.000121, independent-simples t-test; γ band: P = 0.006, independent-simples t-test). (C,D) Representative EEG waveforms and spectrograms EEG power of LHb-EYFP and LHb-ChR2 group under 1.4% isoflurane anesthesia during isoflurane-induced process (C) and recovery process (D). (E) Optogenetic activation of the LHb-RMTg pathway altered the power distribution of EEG frequency bands during the isoflurane-induced process (EYFP-light-on vs ChR2-light-on, δ band: P = 0.00002, independent-simples t-test; α band: P = 0.05, independent-simples t-test; β band: P = 0.001, independent-simples t-test; γ band: P = 0.000022, independent-simples t-test). (F) Optogenetic activation of the LHb-RMTg pathway altered the power distribution of EEG frequency bands during recovery process (EYFP-light-on vs ChR2-light-on, δ band: P = 0.0000037, independent-simples t-test; β band: P = 0.0001, independent-simples t-test; γ band: P = 0.0183, independent-simples t-test). (G) One mechanism for LHb modulate isoflurane anesthesia in mice through RMTg neurons. (H,I) Representative EEG waveforms and spectrograms EEG power in the LHb-RMTg-EYFP and LHb-RMTg-ChR2 during isoflurane-induced process (H) and recovery process (I) (*P < 0.05; **P < 0.01; ***P < 0.001; n = 8 per group).

