
Fig. 3.
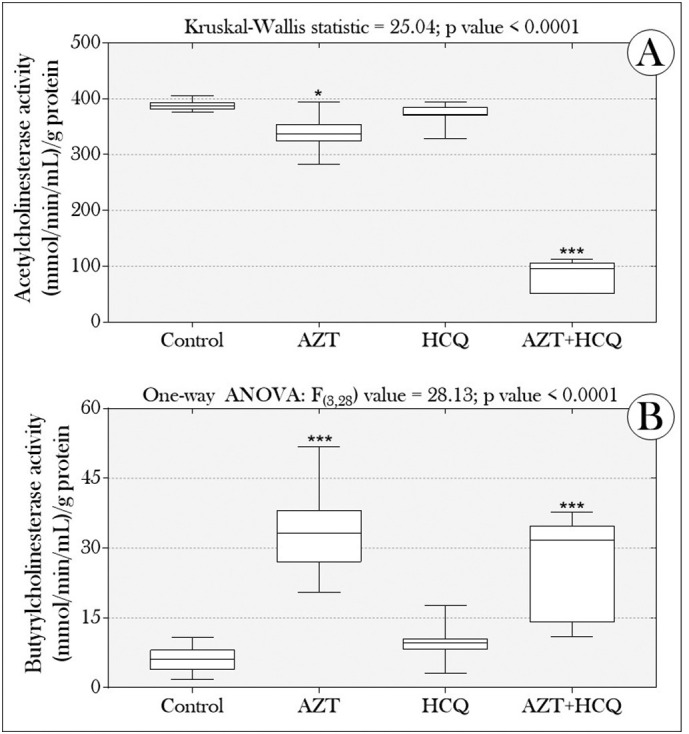
Boxplots of (A) acetylcholinesterase and (B) butyrylcholinesterase activity in tadpoles of P. cuvieri exposed or not to drugs (azithromycin and hydroxychloroquine), alone or in combination. Asterisks indicate significant differences between the treated groups and the control group (n = 96 tadpoles/group, distributed in eight samples containing a pool of 12 animals/each) [p value = 0.01 (*), 0.001 (**), 0.0001 (***), <0.0001 (****)]. C: control; AZT: azithromycin; HCQ: hydroxychloroquine, both at 12.5 μg/L.