Figure 1.
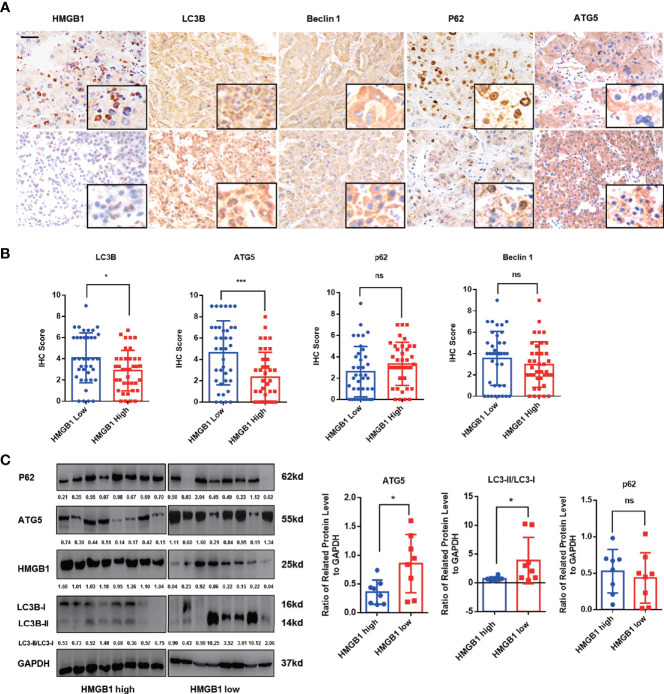
HMGB1 negatively correlates with autophagy markers in HCC. (A) Representative images of immunohistochemical (IHC) staining of HMGB1 and autophagy markers in HCC tissues, scale is 100 μm. (B) Analysis of IHC scores of autophagy markers according to HMGB1 expression in HCC specimens. HMGB1 low, IHC score 0–1; HMGB1 high, IHC score 2–3. (C) Immunoblot analysis of levels of HMGB1 and autophagy markers in 16 HCC patients. Related protein levels were quantified and analyzed based on HMGB1 expression. Data are means ± SEM from three independent experiments, NS means no significance. * means p<0.05, *** means p<0.001 by unpaired student T test.

