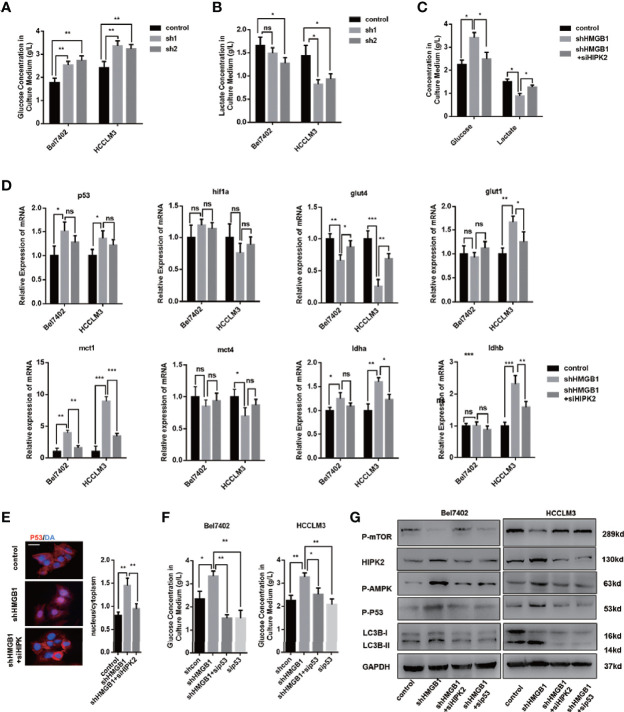
Figure 5.
HIPK2 regulates autophagy levels in HMGB1 deficient cells via restricting glucose uptake. (A) Glucose concentration in cultural medium collected from two HCC cell lines with a non-targeting control lentivirus-shRNA (control) or two lentivirus-shRNA targeting HMGB1 mRNA (sh1, sh2). (B) Lactate concentration in cultural medium collected from cells as described. (C) Role of HIPK2 in impaired glucose uptake in shHMGB1 cells was determined by transfection with HIPK2 siRNA (siHIPK2). (D) Q-PCR experiments were performed to detect mRNA expressions of gene related to glucose metabolism in control, shHMGB1 and shHMGB1+siHIPK2 cells. (E) Representative images of IF staining p53 in control, shHMGB1 and shHMGB1+siHIPK2 cells. The distribution of p53 in cytoplasm or nucleus was quantified and analyzed. (F) Role of p53 in impaired glucose uptake in shHMGB1 cells was determined by transfection with p53 siRNA (sip53). Scale is 100 μm. (G) Protein levels of autophagy markers, AMPK/mTOR and p53 were determined by Western blotting. Data are means ± SEM from three independent experiments, NS means no significance. * means p<0.05, ** means p<0.01, *** means p<0.001 by unpaired student T test.

