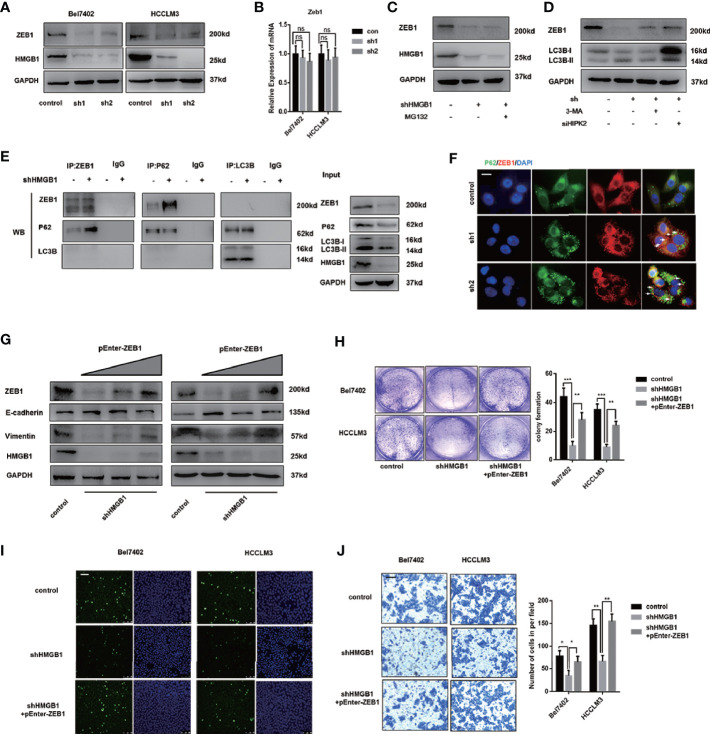
Figure 6.
Autophagic degradation of ZEB1 is essential for HMGB1 deficiency-mediated HCC inhibition. (A) Protein levels of ZEB1 were determined in two HCC cell lines with a non-targeting control lentivirus-shRNA (control) or two lentivirus-shRNA targeting HMGB1 mRNA (sh1, sh2) by wetern blotting. (B) Q-PCR experiments were performed to detect ZEB1 mRNA expression in cells as described. (C) Bel7402 shHMGB1 cells were treated with MG132 (1μM). (D) Bel7402 shHMGB1 cells were treated with 3-MA (5mM) or HIPK2 siRNA respectively. (E) Identification of the ZEB1-p62 interaction in HCC cells by co-immunoprecipitation. Endogenous ZEB1 was pulled down with anti-p62 and endogenous p62 was pulled down with anti-ZEB1, compared with IgG, and vice versa and detected by immunoblotting. (F) Representative images of IF staining p62 and ZEB1 in HCC cells with a non-targeting control lentivirus-shRNA (control) or two lentivirus-shRNA targeting HMGB1 mRNA (sh1, sh2). Scale is 100 μm. (G) Protein levels of E-cadhein, Vimentin and ZEB1 were determined by wetern blotting. Plasmid ZEB1-cDNA was transfected in shHMGB1 cells in dose-dependent manner (pEnter-ZEB1, 0, 2, 4 μg/ml). (H) Cell proliferation of HCC cells transfected as described, was determined by colony formation experiments 12-well plates. (I) Representative images of HCC cells stained by Edu assays. Numbers of Edu positive cells were counted and analyzed. Scale is 400 μm. (J) Invasive capacity of HCC cells were determined by transwell experiments. Numbers of invaded cells were counted and analyzed. Scale is 100 μm. Data are means ± SEM from three independent experiments, NS means no significance. * means p<0.05, ** means p<0.01, *** means p<0.001 by unpaired student T test.

