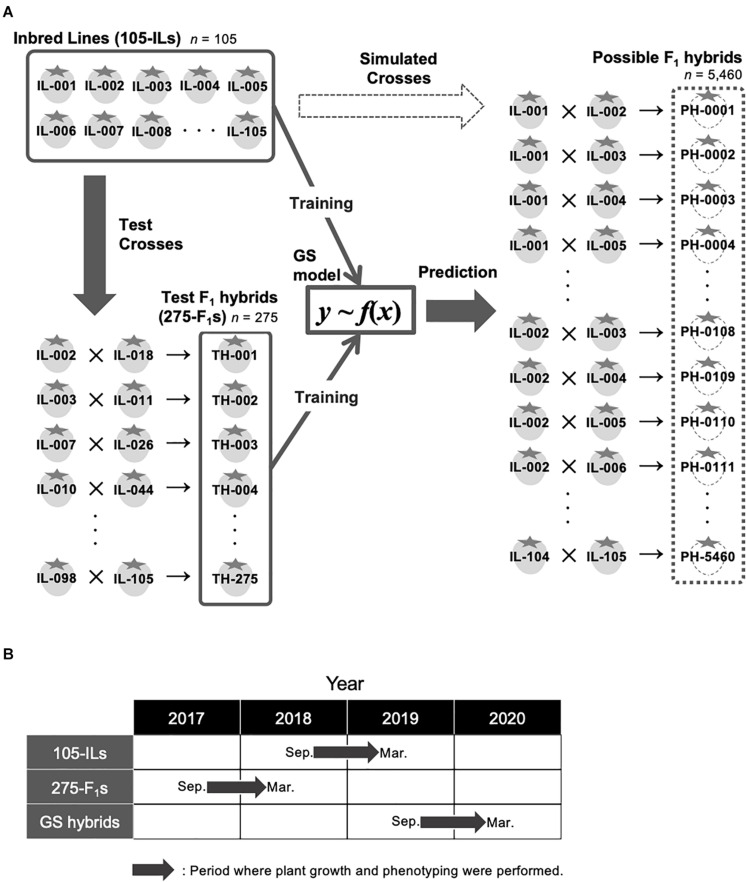
FIGURE 1.
Experimental design in this study. (A) Schematic representation of GS strategy in this study. (B) Periods where plant growth and phenotyping were conducted in this study. ‘105-ILs’ indicates the 105 inbred lines. ‘275-F1s’ indicates the 275 test F1 hybrids. ‘GS hybrids’ indicates the F1 hybrids that were selected for the pilot GS experiment in this study.

