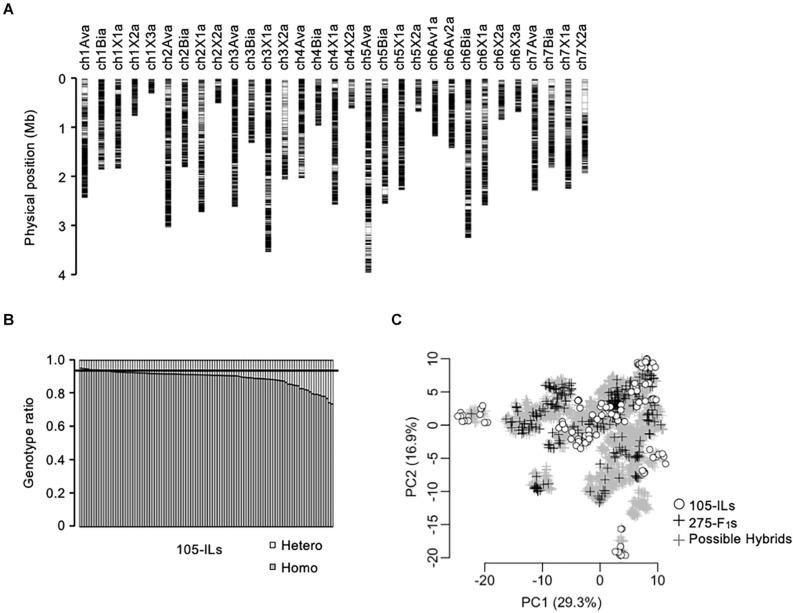
FIGURE 2.
Genetic relationship of the populations in this study. (A) Chromosomal distribution of 28,011-SNPs used in this study. (B) Homozygosity of the 105 inbred lines. The horizontal line indicates expected homozygosity genotype ratio (i.e., 0.9375). (C) Principal component analysis of the populations in this study based on 28,011-SNP genotypes. The gray crosses indicate the 5,460 possible F1 hybrids. The black crosses indicate the 275 test F1 hybrids. The white circles indicate the 105 inbred lines.

