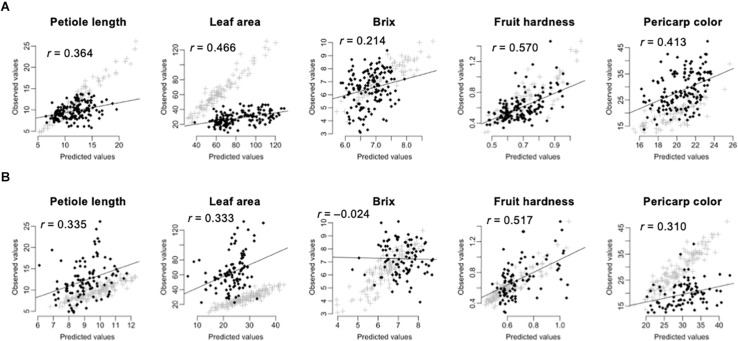
FIGURE 3.
Across population prediction accuracy of GS models. The predicted values were calculated by GBLUP with additive plus dominant effect model. The value in each panel indicates the correlation coefficient (r) between predicted and observed values. The black squares indicate the predicted values. The gray crosses indicate the fitted values in the training population. (A) Prediction of the 275 test F1 hybrids by using the 105 inbred lines as the training population. (B) Prediction of the 105 inbred lines by using the 275 test F1 hybrids as the training population.

