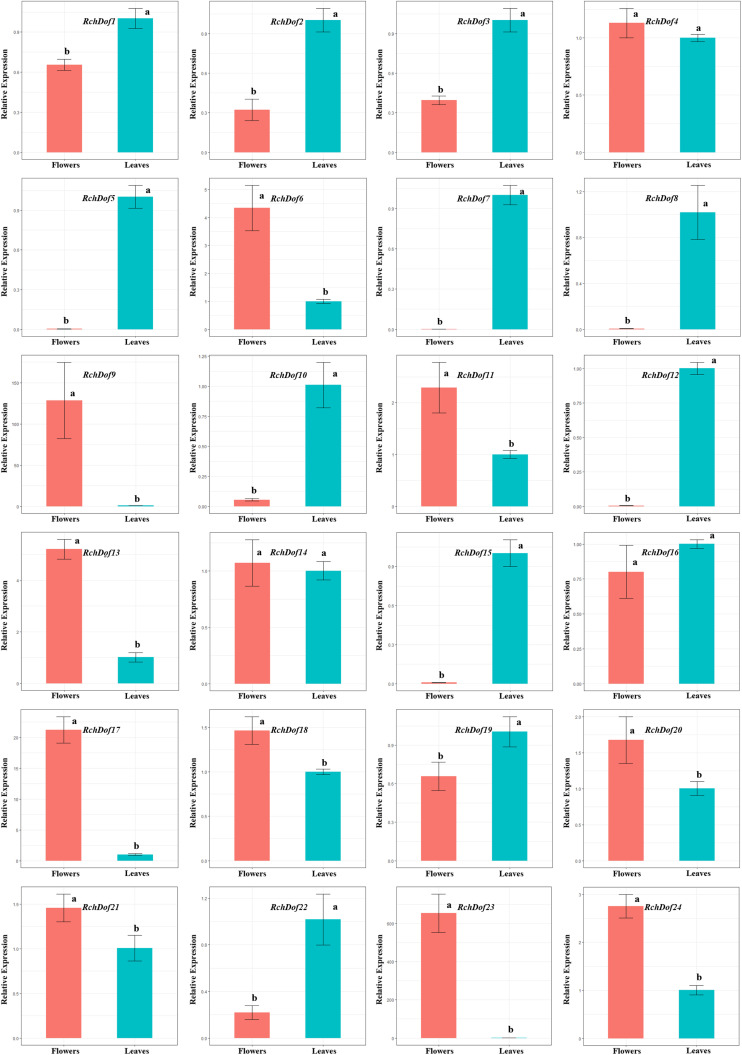
FIGURE 6.
Expression patterns of RchDof genes in tissues of rose. The x-axis shows different tissues, while the y-axis represents the relative expression levels of RchDof genes compared with GAPDH gene using 2− ΔΔCT method. Error bars indicate the standard deviations (mean ± SD) of three independent replicates. The histogram bars labeled with different letters (a and b) above them are significantly different (least significant difference test, P < 0.05).

