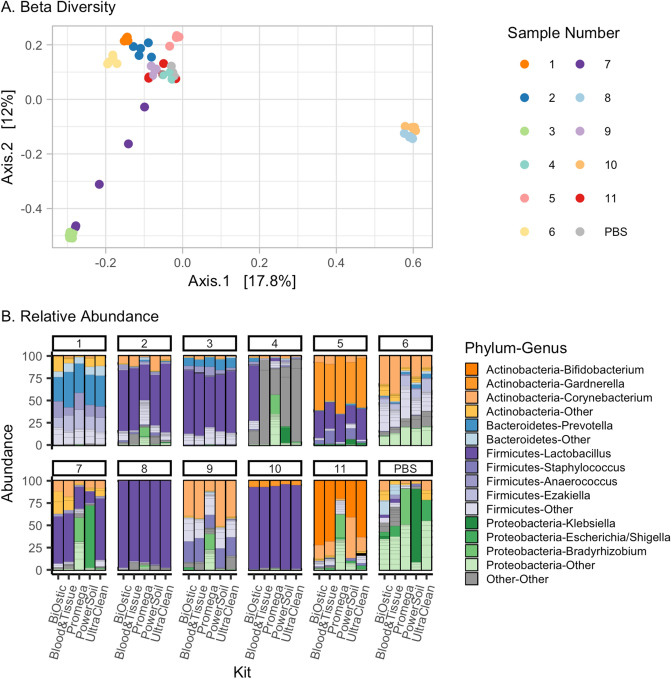
Figure 3.
Differences in the DNA isolation methods do not result in drastic changes in relative abundances of identified genera. (A) Multidimensional scaling plot using Bray Curtis distance demonstrates that most samples are not significantly different due to DNA isolation kit (p = 0.87 in PERMANOVA analysis), though sample 7 was not tightly clustered, indicating that these samples may have significant variations in microbiome composition by kit. (B) Stacked bar plots represent the microbial composition of each sample after DNA isolation and 16S rRNA gene sequencing. Only sample 4, 7, and negative control PBS exhibit more variability across multiple kits.

