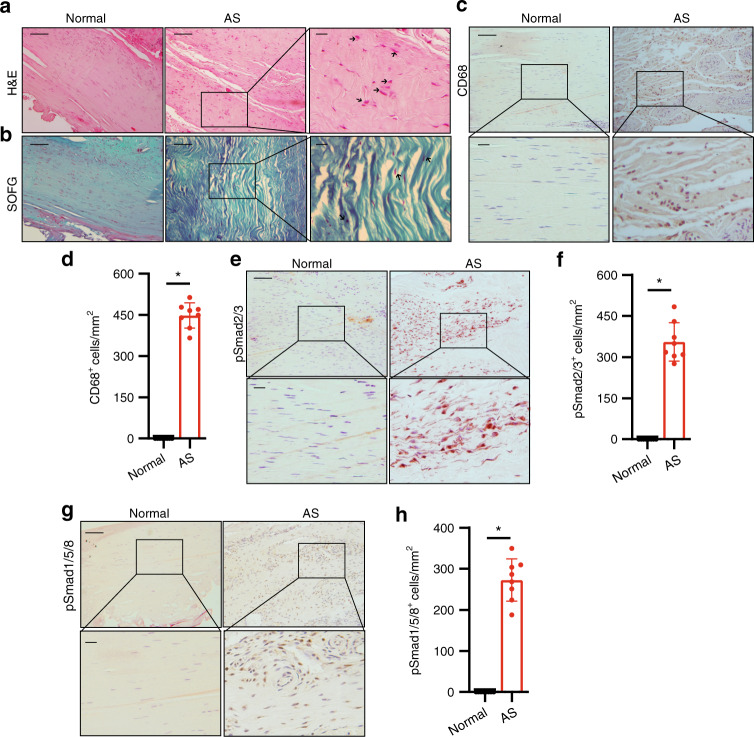
Fig. 2.
Elevated TGF-β levels in the early inflammatory stage of AS. a Hematoxylin and eosin (H&E) staining and b Safranin O–Fast Green (SOFG) staining of normal and inflamed interspinous ligaments. In the AS group, the right panels show magnified views of the boxed area in the left panels. Scale bar: 100 μm (two panels on the right); 25 μm (left panel). c Immunostaining and d quantitative analysis of CD68-positive cells (brown) in the normal and inflamed interspinous ligaments (sagittal view). The bottom panels show magnified views of the boxed area in the top panels. Scale bar: 100 μm (top panels); 25 μm (bottom panels). e Immunostaining and f quantitative analysis of pSmad2/3-positive cells (brown) in the normal and inflamed interspinous ligaments (sagittal view) in normal ligaments and inflammatory ligaments. The bottom panels show magnified views of the boxed area in the top panels. Scale bar: 100 μm (top panels); 25 μm (bottom panels). g Immunostaining and h quantitative analysis of pSmad1/5/8-positive cells (brown) in the normal and inflamed interspinous ligaments (sagittal view). The bottom panels show magnified views of the boxed area in the top panels. Scale bar: 100 μm (top panels); 25 μm (bottom panels)

