Fig. 4.
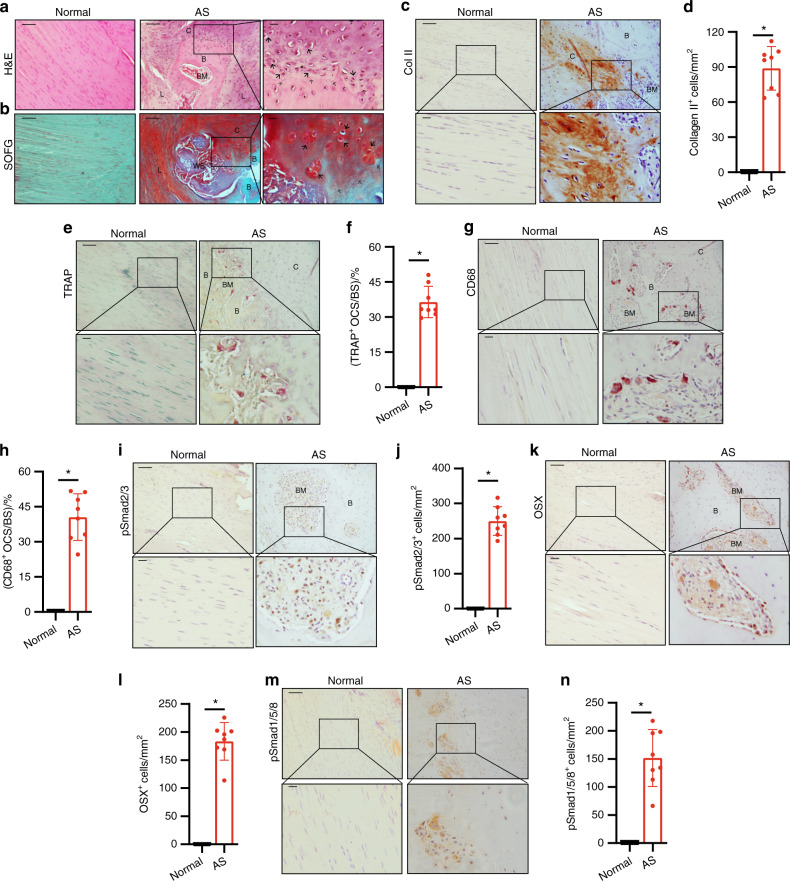
Progression of endochondral heterotopic ossification in AS patients. a Hematoxylin and eosin (H&E) staining and b Safranin O–Fast Green (SOFG) staining of normal interspinous ligaments and endochondral-ossified interspinous ligaments. In the AS group, the right panels show magnified views of the boxed area in the left panels. Scale bar: 100 μm (two panels on the right side); 25 μm (left panel). c Immunostaining and d quantitative analysis of collagen II-positive cells (brown) in the normal and chondrogenic interspinous ligaments (sagittal view). The bottom panels show magnified views of the boxed area in the top panels. Scale bar: 100 μm (top panels); 25 μm (bottom panels). e Tartrate-resistant acid phosphatase (TRAP)-positive cells (red) and f quantitative analysis of TRAP-positive osteoclast (red) surface (OCS) per bone surface (BS). The bottom panels show magnified views of the boxed area in the top panels. Scale bar: 100 μm (top panel); 25 μm (bottom panel). g Immunostaining and h quantitative analysis of the number of CD68-positive osteoclast (brown) surface (OCS) per bone surface (BS). The bottom panels show magnified views of the boxed area in the top panels. Scale bar: 100 μm (top panel); 25 μm (bottom panel). i Immunostaining and j quantitative analysis of pSmad2/3-positive cells (brown) in the normal ligaments and endochondral-ossified interspinous ligaments (sagittal view). The bottom panels show magnified views of the boxed area in the top panels. Scale bar: 100 μm (top panel); 25 μm (bottom panel). k Immunostaining and l quantitative analysis of Osterix-positive cells (brown) in the normal and endochondral-ossified interspinous ligaments (sagittal view). The bottom panels show magnified views of the boxed area in the top panels. Scale bar: 100 μm (top panel); 25 μm (bottom panel). m Immunostaining and n quantitative analysis of pSmad1/5/8-positive cells (brown) in the normal and inflammatory interspinous ligaments (sagittal view). The bottom panels show magnified views of the boxed area in the top panels. Scale bar: 100 μm (top panels); 25 μm (bottom panels). B, bone; BM, bone marrow; C, cartilage

