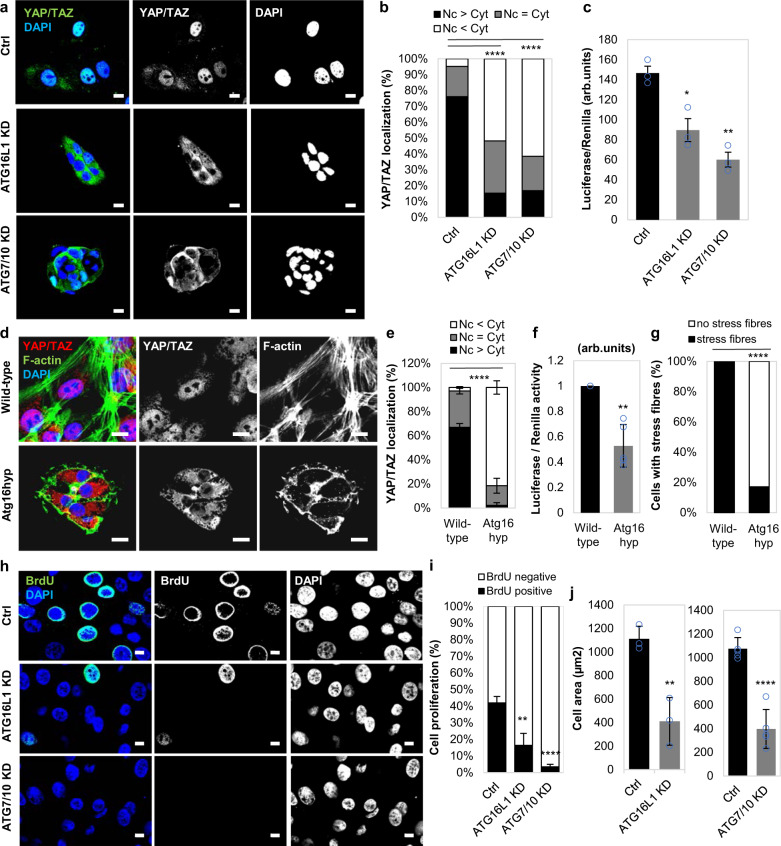
Fig. 1. YAP/TAZ activity is inhibited in autophagy-deficient mammary epithelial cells.
a Representative confocal images of YAP/TAZ endogenous immunostaining in MCF10A cells exposed to control, ATG16L1 or ATG7/10 siRNAs. DAPI = nucleus. Scale bars are 10 µm. The experiment was repeated twice with similar results. b YAP/TAZ localisation (nuclear—Nc or cytoplasmic—Cyt) in MCF10A cells exposed to control, ATG16L1 or ATG7/10 siRNAs (n = 126 (Ctrl), 170 (ATG16L1 KD), 166(ATG7/10 KD) cells; ****P < 0.0001; chi-squared test). The experiment was repeated twice with similar results. c Luciferase assay for YAP/TAZ activity in MCF10A cells exposed to control, ATG16L1 or ATG7/10 siRNAs. Bars represent the mean ± s.d. (n = 3 independent experiments; **P < 0.01, *P < 0.05; two-tailed one sample t-test). d Representative confocal images of endogenous YAP/TAZ and F-actin (Phalloidin) in primary mammary epithelial cells (pMECs) isolated from wild-type and Atg16L1 hypomorph (Atg16hyp) mice. Scale bars are 10 µm. The experiment was repeated twice with similar results. e YAP/TAZ localisation in wild-type (n = 3 mice) and Atg16hyp (n = 4 mice) pMECs. Bars represent the mean ± s.d. (****P < 0.0001; two-way ANOVA). f Luciferase assay for YAP/TAZ activity in wild-type and Atg16hyp pMECs. Bars represent the mean ± s.d. (n = 3 mice; **P < 0.01; two-tailed one sample t-test). g Percentage of cells with F-actin stress fibres in wild-type and Atg16hyp pMECs (n = 98 (wild-type) and 292 (Atg16hyp) cells; ****P < 0.0001; chi-squared test). The experiment was repeated twice with similar results. h Representative images of BrdU immunostaining in MCF10A cells exposed to control, ATG16L1 or ATG7/10 siRNAs. Scale bars are 10 µm. The experiment was repeated twice with similar results. i The graphs show the percentages of BrdU-positive MCF10A cells, after exposure to control, ATG16L1 or ATG7/10 siRNAs: mean ± s.d. (n = 3 independent experiments; ****P < 0.0001, **P < 0.01; two-tailed t-test). j Size of autophagy inhibited cells: MCF10A cells exposed to control, ATG16L1 (n = 3 independent experiments) or ATG7/10 (n = 5 independent experiments) siRNAs. Confocal images of each cell type were analysed to measure cell area using ZEN software. Bars represent the mean ± s.d. (****P < 0.0001, **P < 0.01; two-tailed t-test). Exact P values for asterisks: c (from left to right) 0.0132, 0.0010; f 0.0033; i 0.0058; and j 0.0061.

