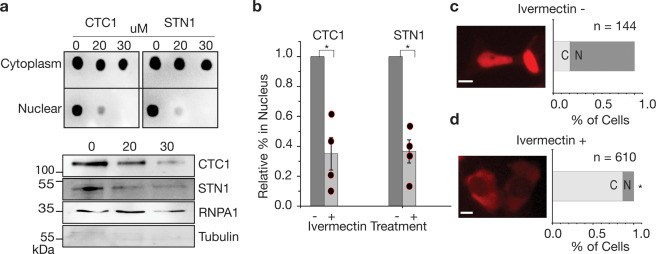
Fig. 3. Nuclear import of CTC1/STN1 is reduced by Ivermectin treatment.
a Cell lysate fractionation results for CTC1, and STN1 after being treated with Ivermectin at varying concentrations (μM). Dot blots as well as western blotting is shown to confirm the nuclear fractions. b Quantification of cell fractionation studies for ivermectin treatment. *p-value < 0.05. Student’s t-test results comparing control and ivermectin-treated cells are as follows. CTC1, p-value = 0.021392. STN1, p-value = 0.019171. c, d Epifluorescence microscopy analysis of mCherry-CTC1 or control cells after undergoing 20 μM ivermectin. Scale bar is ~5 μm.

