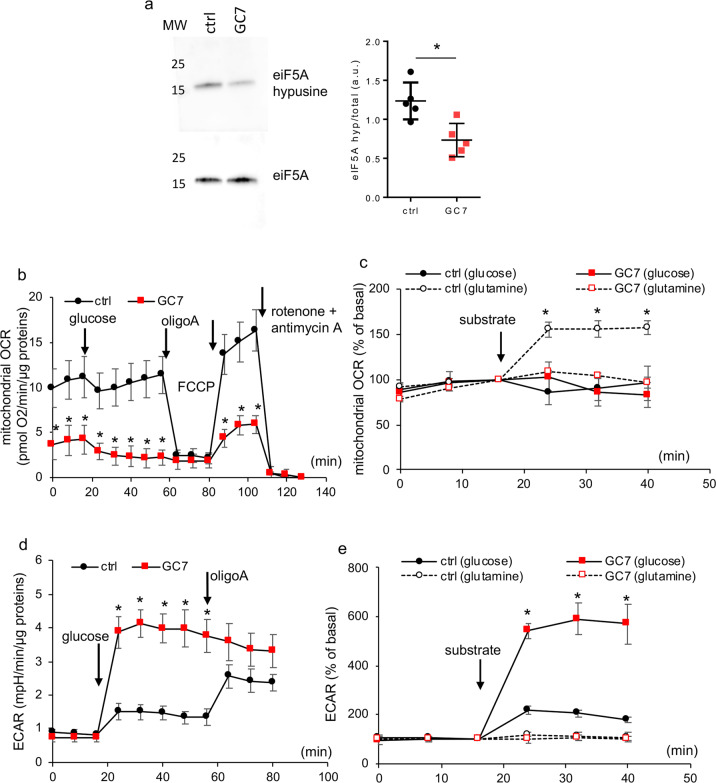
Fig. 1. GC7 induces a switch in cell metabolism and substrate preference.
Confluent PCT cells were treated or not with 30 µM GC7 for 24 h and then used for different analysis. a Representative western blot displaying inhibition of eiF5A hypusination and ratio between optical density of hypusine and eIF5A band. MW molecular weight. b–e Cells were analysed using Seahorse technology to evaluate oxygen consumption (b, c) and extracellular acidification (d, e) after addition of 10 mM glucose (b–e) or 2 mM glutamine (c, e). Addition of other compounds are indicated. Dots displayed mean ± SD of three independent experiments. *p < 0.05 evaluated using Mann–Whitney (b, d) or Kruskal–Wallis (c, e) tests.

