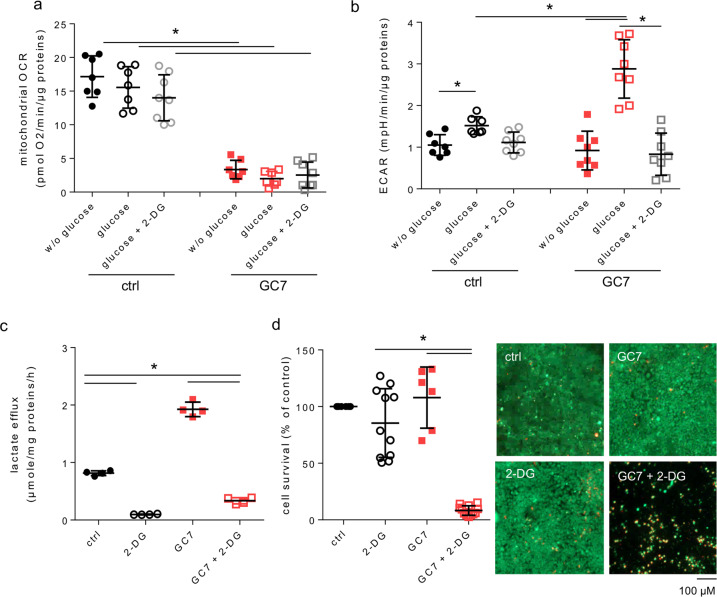
Fig. 4. Glycolysis is essential to GC7-treated cell metabolism and survival.
a, b Confluent PCT cells were treated or not with 30 µM GC7 for 24 h and then (a) oxygen consumption (OCR) and (b) extracellular acidification (ECAR) rates were measured using Seahorse technology. Analysed was performed first without glucose and then glucose (10 mM) and 2-deoxy-glucose (2-DG, 25 mM) were sequentially added as indicated. c Confluent PCT cells were treated or not with 30 µM GC7 for 24 h and by 25 mM 2-DG the last 8 h. Graphic displayed measurement of lactate media content after 8 h related to whole-cell proteins content. d Confluent PCT cells were treated or not with 30 µM GC7 and 25 mM 2-DG for 24 h. Mortality was evaluated using live/dead cells fluorescence assay. Representative pictures for each group are displayed and show live (green, calcein-FITC) and dead (red, ethidium bromide homodimer) cells. Scale bar is indicated. Graphics displayed scatter plot of 8 (a, b), 4 (c) and 11 (d) independent values and mean ± SD. *p < 0.05 evaluated using Kruskal–Wallis.

