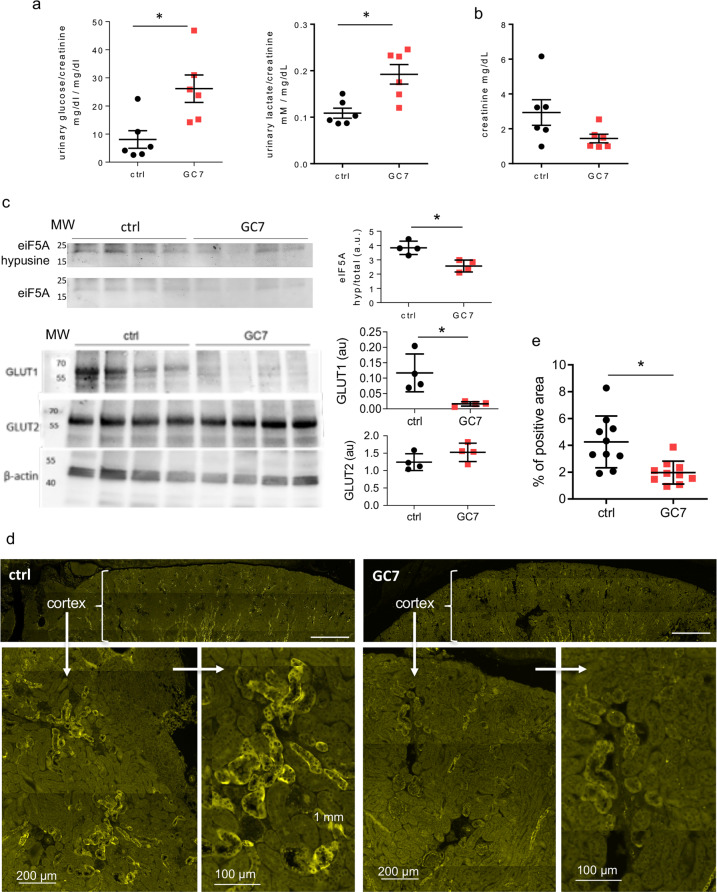
Fig. 7. Impact of a 3-days GC7 treatment on kidney glucose metabolism.
Mice were treated 3 days with GC7 (3 mg/kg, i.p., “GC7” group) or vehicle only (NaCl, “ctrl” group) and metabolic parameters were analysed at the end of the treatment. a Glucosuria (glucose/creatinine) and lactaturia (lactate/creatinine) measured in bladder urine. b Urinary creatinine (mg/dL). c Hypusination of eIF5A and GLUT1 and GLUT2 protein levels evaluated by western blot using four kidney protein extract for each group. MW molecular weight. Graphic displayed hypusine/total eIF5A ratio and GLUT/β-actin ratio using optical density band values. d Mosaic reconstruction of whole-kidney sections from untreated and GC7-treated mice displaying GLUT1 signals in the cortical region. Magnification of a representative cortical regions from each group. Scale bars are indicated. e Quantification of GLUT1 immunofluorescence. Graphics displayed the scatter plot of 4 (c), 6 (a, b) or 10 (e) independent values and mean ± SD. *p < 0.05 evaluated using Mann–Whitney test.

