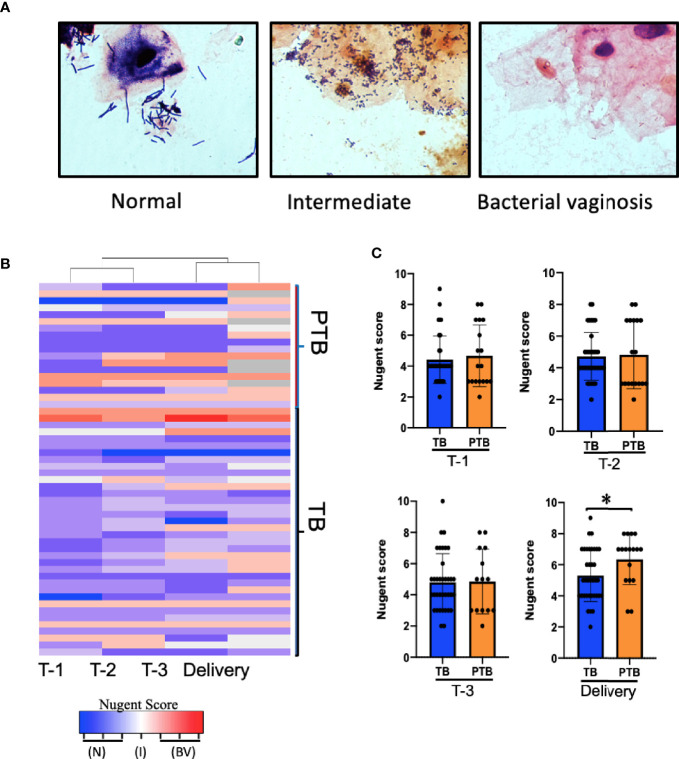
Figure 2.
Association between Nugent score and PTB. (A) Representative images of Gram-stained vaginal swabs with scoring normal, intermediate, and BV, Slides were evaluated under 1,000x magnification according to the 10-point Nugent scale. (B) Heatmap showing the Nugent scores of individual women who delivered at term (TB) and women who experienced pre-term birth (PTB). Columns represent the trimester of pregnancy. Each row represents one subject. (C) Comparison of the average Nugent score in the TB or PTB groups during pregnancy. P-value was calculated using unpaired t-test (two-tailed) with Welch’s correction for difference in Nugent score between TB and PTB groups. *p < 0.05. T-1: Trimester-1, T-2: Trimester-2; T-3: Trimester-3; N, Normal; I, Intermediate; BV, Bacterial Vaginosis.

