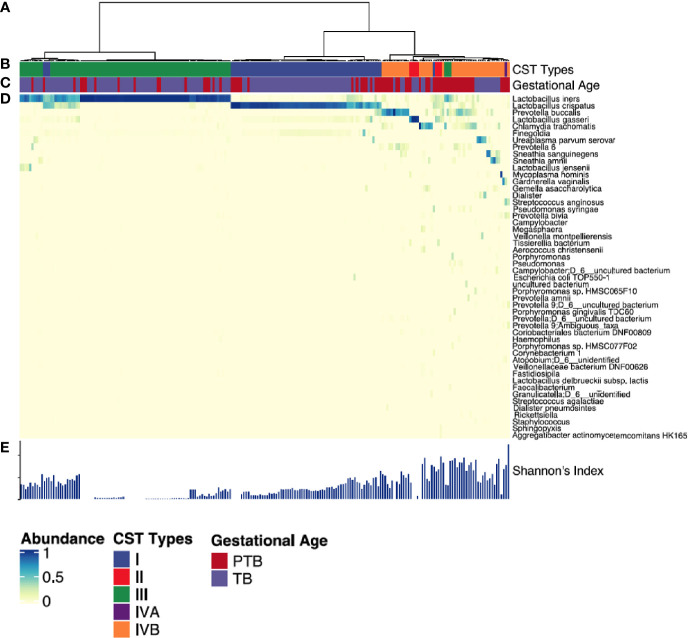
Figure 4.
Vaginal microbiota profiles of women who had PTB and TB deliveries. (A) Hierarchical clustering of Euclidean distance matrices with Ward linkage on relative abundances of reads for each OTU within individual vaginal swab samples collected at all time points. (B) Community state types (CST) identified across all the study subjects. Each CST is represented by a different color according to the key shown underneath. (C) Gestational age category (PTB shown in red, TB shown in blue). (D) Heatmap of relative abundances of bacterial species within the vaginal microbiota of each woman. Each column represents a woman’s vaginal microbiota profile, and each row represents a bacterial species. Only species that represent at least 0.5% of the total microbiome in at least one sample are shown. (E) Shannon diversity indices calculated for each sample. Each CST is represented by a different color: CST-I, Lactobacillus crispatus-dominated; CST-II, Lactobacillus gasseri-dominated; CST-III, Lactobacillus iners-dominated; CST-IVA, lower abundance of Lactobacillus spp together with low proportions of anaerobic bacteria such as Anaerococcus, Corynebacterium, and Streptococcus; CST-IVB: dominated by higher abundance of the genera Atopobium, Prevotella, Parvimonas, Sneathia, Gardnerella, Mobiluncus, or Peptoniphilus and several other taxa.

