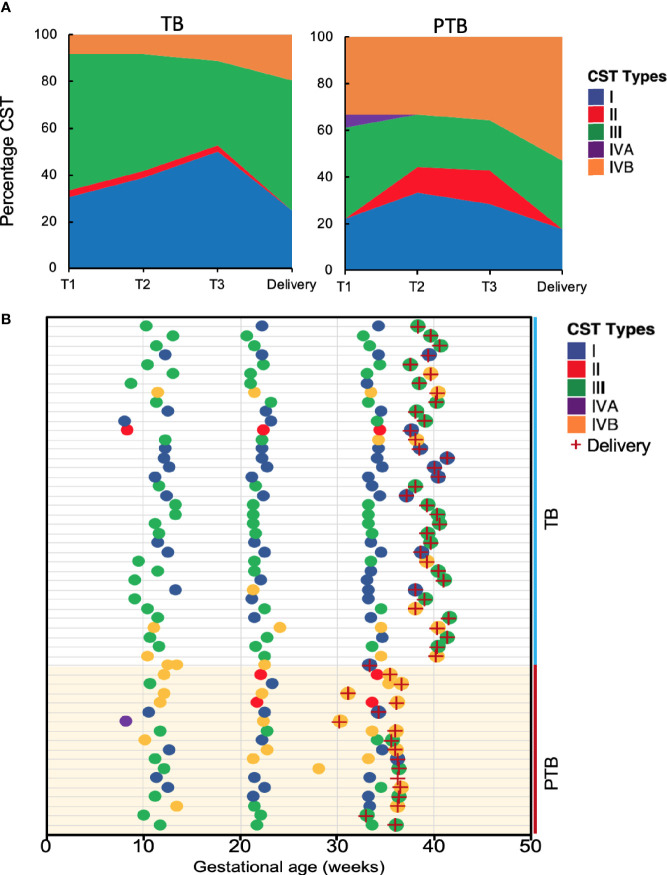
Figure 5.
Vaginal community state types during the course of pregnancy. (A) Stacked area charts of community state type (CST) showing the dynamics of the vaginal microbiome in the full term birth (TB) and preterm birth (PTB) groups at the three trimesters of pregnancy (T-1, T-2, T-3) and at delivery. X-axis represents the gestational age T-1: Trimester-1; T-2: Trimester-2; T-3: Trimester-3, y-axis represents the percentage of each CST in the samples from each group. (B) Profiles of community state type (CST) for pregnant women who delivered at term (TB) and those who had preterm birth (PTB) as a function of gestational age. Delivery is indicated by a red cross.

