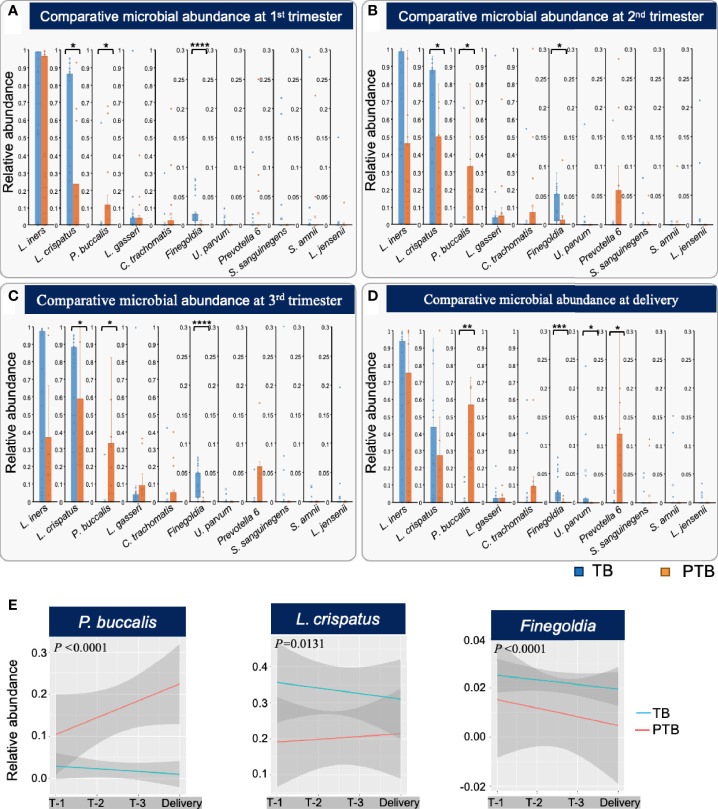
Figure 6.
Different bacterial taxa associated with TB and PTB. (A) Differences in relative abundance of the top 11 microbial taxa found between full term birth (TB) and preterm birth (PTB) groups in the first trimester; (B) second trimester; (C) third trimester, and (D) at the time of delivery. Blue bars represent the TB group, while orange bars represent PTB. The asterisks indicate a significant difference between two groups (*P < 0.05, **P < 0.01, ***P < 0.001, ****P < 0.0001). (E) Longitudinal trends in relative abundance of the statistically significant microbial taxa identified by comparing TB and PTB groups, analyzed using ggplots. Blue lines represent the TB group and red lines the PTB group. The P-values were calculated using the unpaired t-test (two-tailed) with Welch’s correction for difference in proportional microbial abundance between TB and PTB groups.

