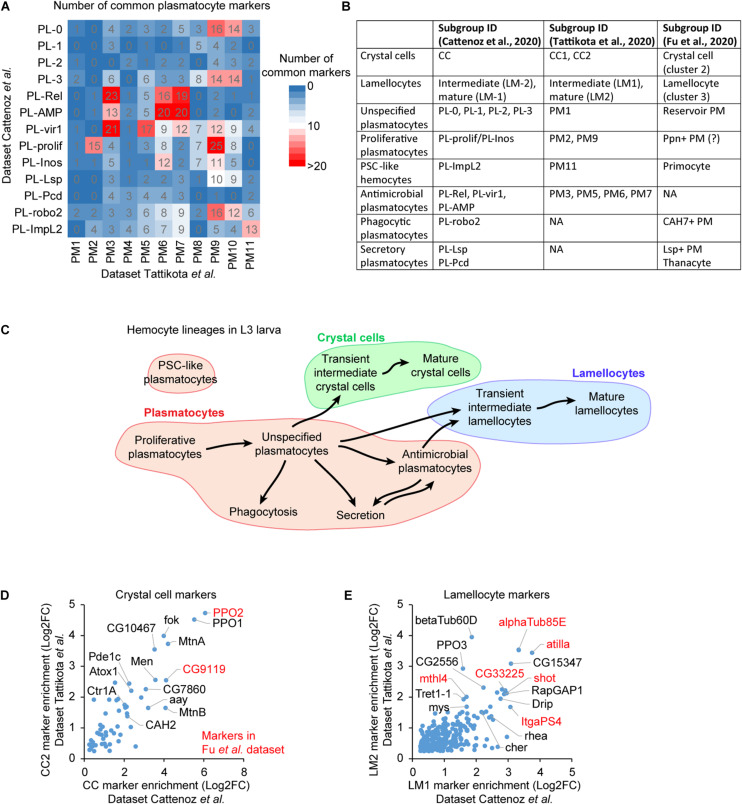
FIGURE 2.
Defining a consensual repertoire of the hemocyte subgroups. (A) Number of common markers between the plasmatocyte subgroups identified in Cattenoz et al. (2020) (rows) and in Tattikota et al. (2020) (column). The number of markers is highlighted by the color gradient (from 0 in blue to >20 in red). (B) Concordance amongst the hemocyte subgroups across the three datasets. (C) Outline of the lineage predictions among the hemocyte subgroups, based on the prediction analyses in Cattenoz et al. (2020) and Tattikota et al. (2020) and on the present comparative analysis. The proliferative plasmatocytes are at the origin of most hemocytes, they give rise to a large pool of unspecified plasmatocytes that further differentiate to acquire specific properties such as phagocytosis, secretion or antimicrobial peptide production. Subsets of unspecified plasmatocytes and antimicrobial plasmatocytes transdifferentiate to produce crystal cells or lamellocytes. (D) Scatter plot representing the enrichment levels of the crystal cell markers common to the subgroups CC2 (y-axis) from Tattikota et al. (2020) and CC (x-axis) from Cattenoz et al. (2020). The Log2 fold change (Log2FC) of the enrichment is represented. The markers with the strongest enrichment are indicated on the graph, those also identified in Fu et al. (2020) are highlighted in red. (E) Scatter plot representing the enrichment of the lamellocyte markers in the indicated subgroups. The representation is as in panel (D).

