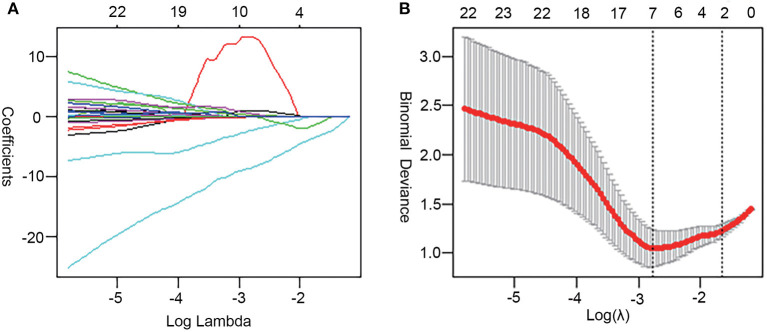
Figure 3.
Feature selection by LASSO regression. (A) LASSO coefficient sketch of 99 features. With increasing lambda, the coefficient of unimportant features gradually tended to 0. (B) The deviance profile was made by adjusting the optimal regularization parameters (λ) based on 10-fold cross-validation. The left dashed line delineates the minimum norm and the right indicates 1-standard error norm (1-SE). This study utilized the minimum norm.

