Figure 5.
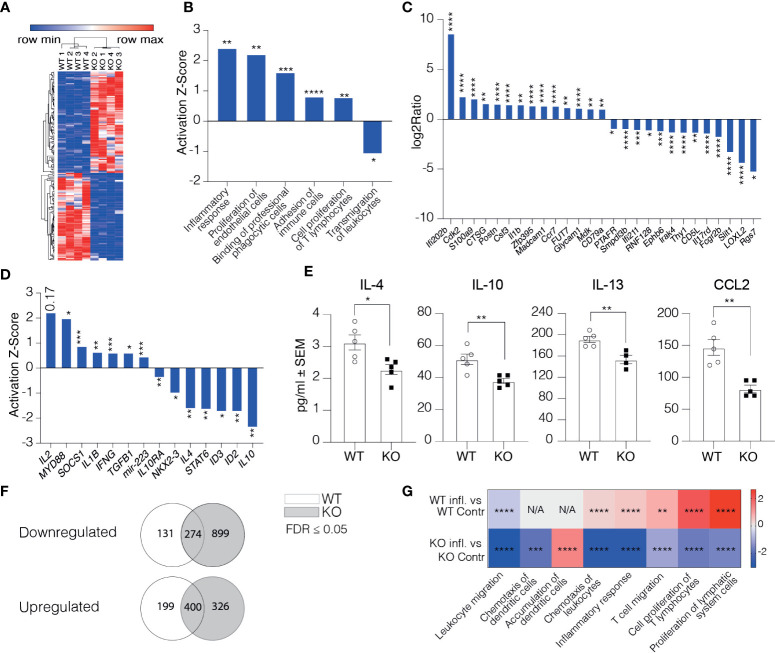
Clever-1 supports lymphatic endothelial cell tolerance. (A) Heat map of the gene expression differences in LECs obtained from LNs of Clever-1 KO and their WT controls. Unsupervised hierarchical clustering was performed on the log 2 ratio of significantly (FDR < 0.05) up- (red) and down-regulated (blue) genes. (B) Altered pathways in KO LECs compared to WT LECs analyzed by using the disease and Bio-function in IPA. (C) Genes in KO LECs (Fold Change ≥ 2) belonging to the altered pathways shown in (B). (D) IPA Upstream regulator analysis of DEGs between WT and Clever-1 KO LECs at steady state. (E) Cytokine levels in the dLNs at steady state. (F) Venn diagrams summarizing differentially expressed genes 1 day after footpad injection with OVA emulsified in incomplete Freund’s adjuvant. (G) Most significantly altered pathways in inflamed and non-inflamed LECs of WT and KO mice analyzed by using the disease and Bio-function in IPA. Each dot represents one mouse. Data and statistical significance in (B, D, G) were analysed by using IPA, *P < 0.05, **P < 0.01 and ***P < 0.001 ****P < 0.0001. Data and statistical significance in (C) were analysed by using Illumina, * FDR < 0.05, **FDR < 0.01 and *** FDR < 0.001 **** FDR < 0.0001. Data in (E) is expressed as mean ± SEM. *P < 0.05 and **P < 0.01 , two-tailed Student’s t-test.

