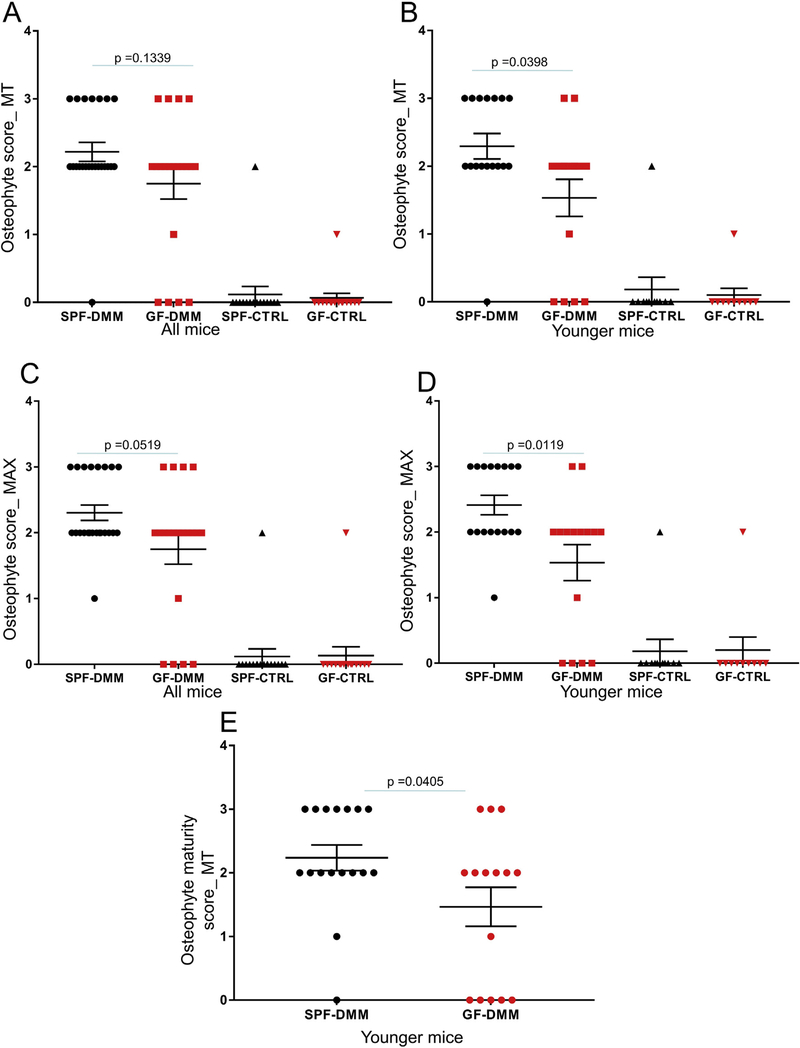
Fig. 3.
Comparison of osteophyte scores between SPF and germ-free (GF) mice. The osteophyte scores are shown for the DMM operated and unoperated control (CTRL) joints and were reported either separately for MT (A,B) or as a MAX score for the medial side (C,D). Panels A,C are showing results from mice of all ages and B,D, from the younger mouse group. The osteophyte maturity scores are presented in the DMM knees of younger SPF and GF mice (E). Dot plots of the mean ± S.E.M.

