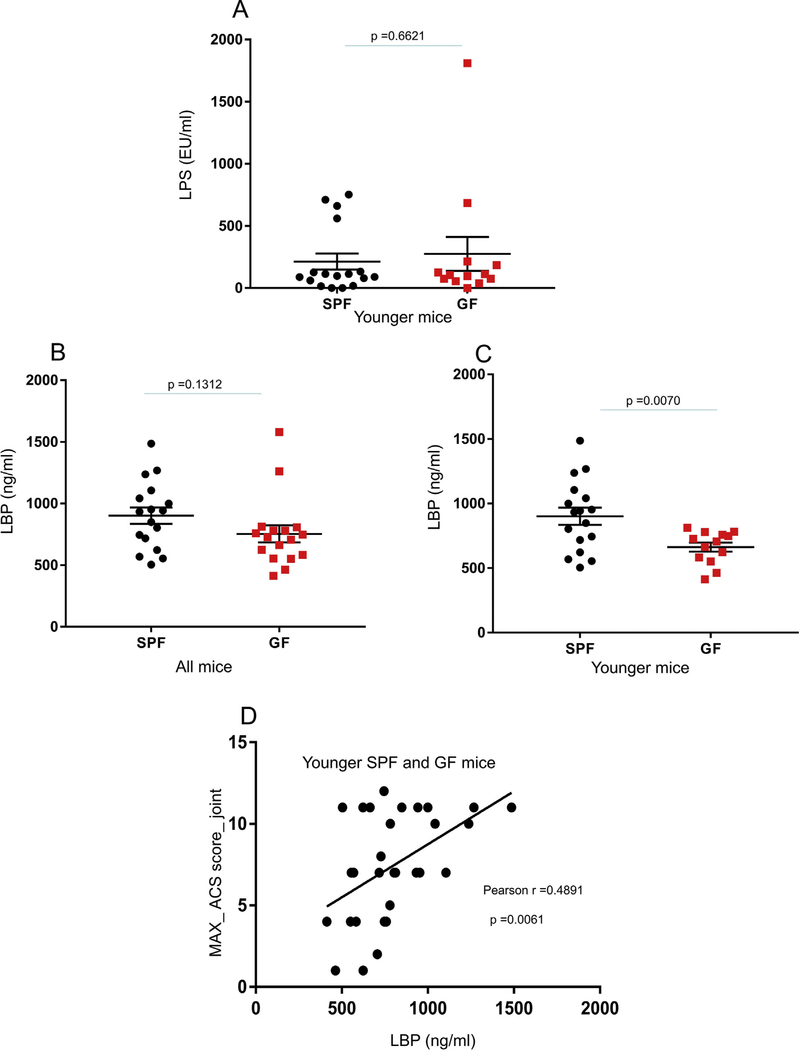
Fig. 5.
Comparisons of LPS and LPS binding protein (LBP) between SPF and germ-free (GF) mice. Concentrations of LPS in plasma samples collected from the younger group of SPF and GF mice (A). Concentrations of LBP in SPF and GF mouse plasma samples were reported for mice of all ages (B) or specifically for the younger mouse group (C). Dot plots of the mean ± S.E.M. (A–C). Scatterplot with overlaid regression line shows the association between ACS_MAX scores and LBP concentration in plasma samples from the SPF and GF younger mouse group (D).

