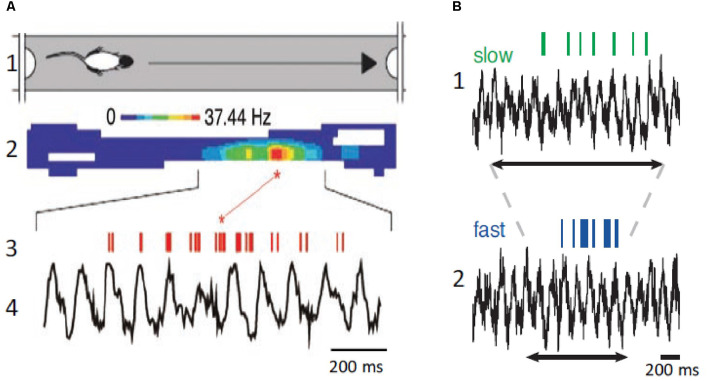
Figure 4.
Place neurons and θ. (A1) Schematic diagram of rat traveling in the place field. (A2) Color coded display of place neuron firing rate in the place field. (A3,A4) Place neuron firings (red, upper) and field θ (lower). Note that the neuron displays phase precession and fires at a higher rate at a specific position in the place field. (B1) Place cell firing (green, upper) and corresponding field θ (lower) during slow locomotion (mean speed 31 cm/s). (B2) Same as (B1), but fast locomotion (mean speed 55 cm/s). The arrows indicate the time it takes the rat to cross the place field. Note that there is no change of field θ and that the neuron displays phase precession at both speeds but fires at a higher rate during the fast trial. (A) Modified from Buzsaki and Draguhn (2004); (B) modified from Geisler et al. (2007).

