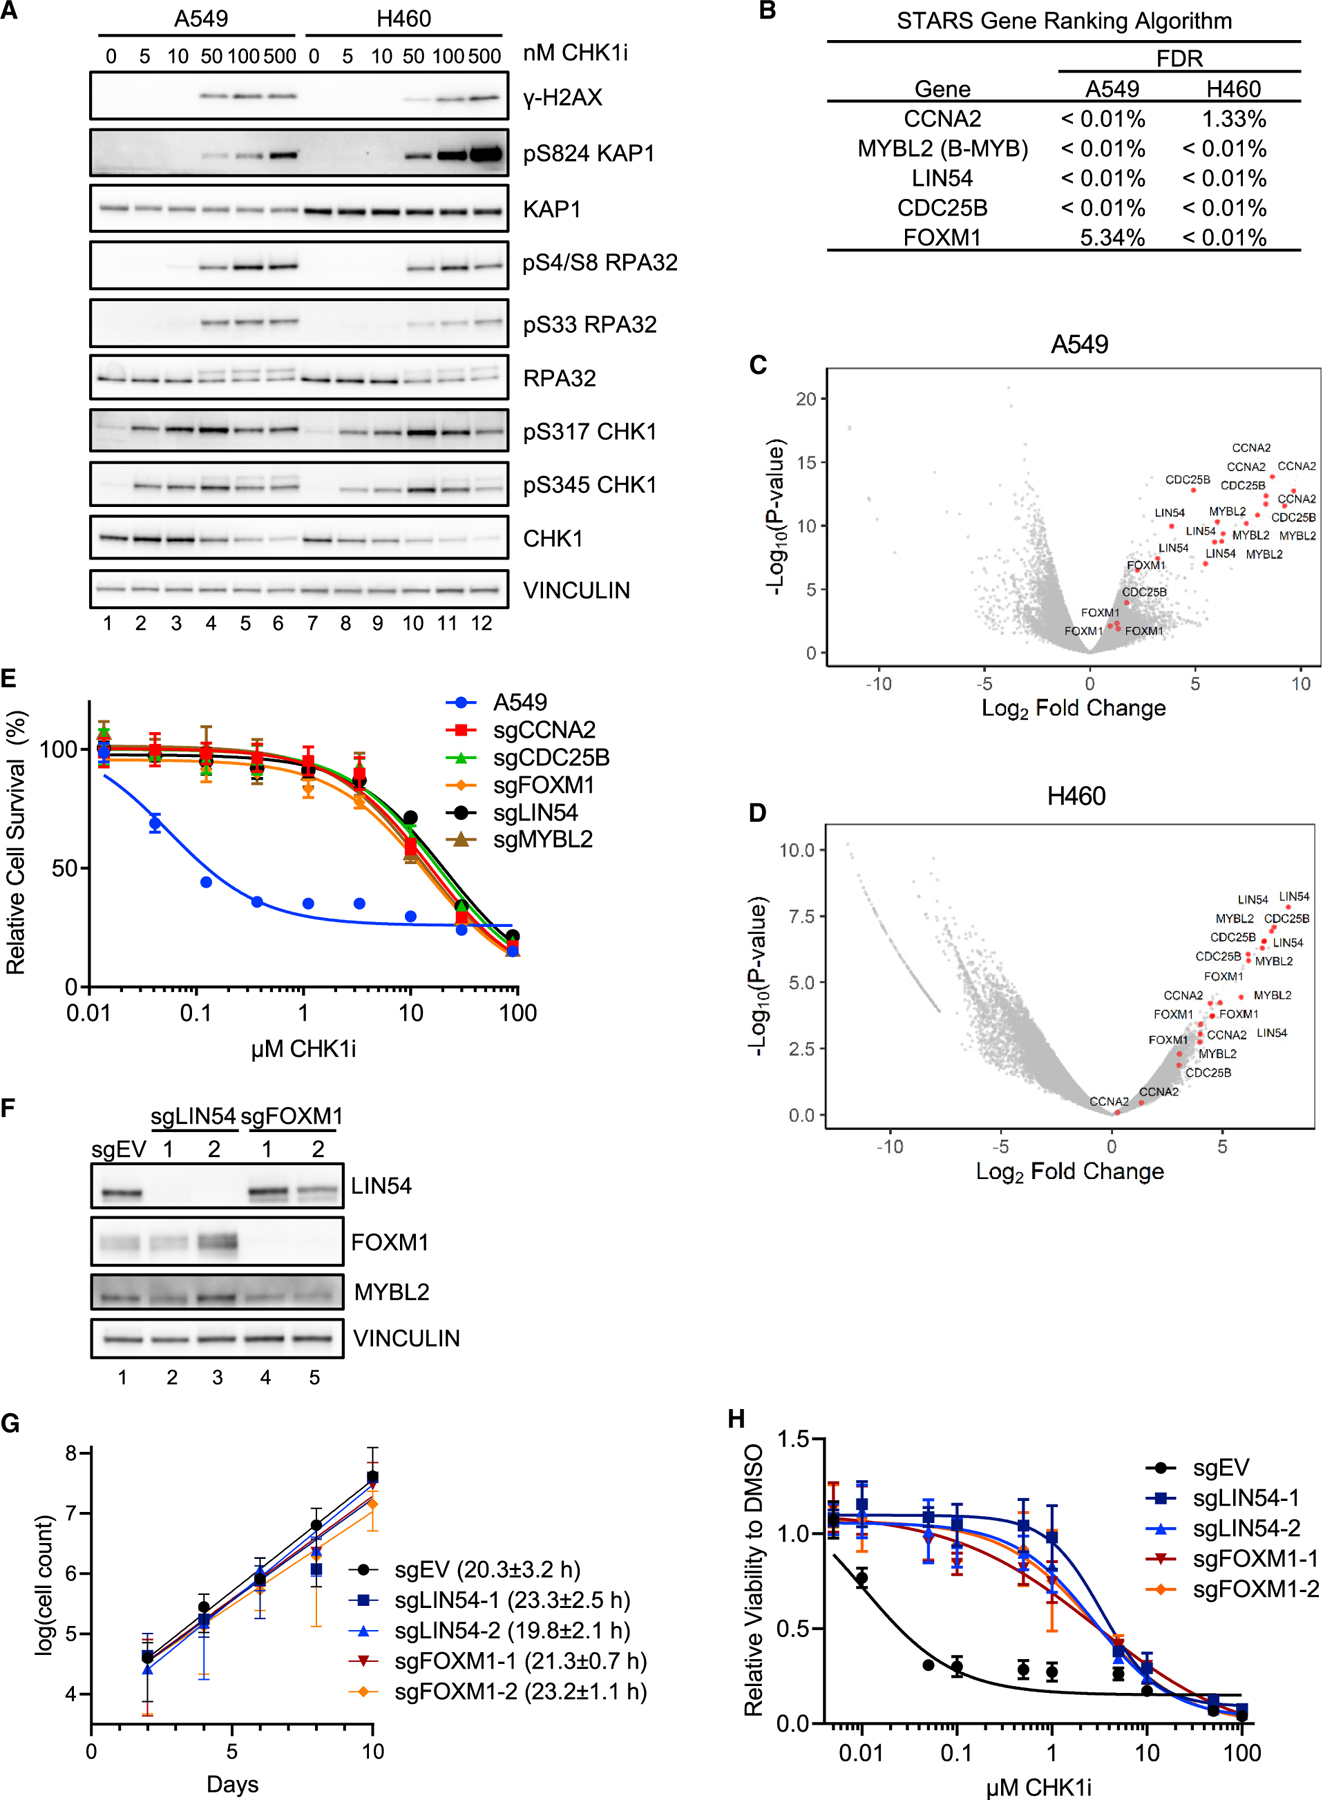
Figure 1. MMB-FOXM1 complex components are required for CHK1i sensitivity in NSCLC cells.

(A) Immunoblot of replication stress markers in A549 and NCI-H460 cells after treatment with increasing CHK1i concentrations for 24 h.
(B) Table of genes identified by the STARS algorithm as having multiple sgRNAs significantly enriched after CHK1i treatment.
(C and D) Volcano plots of sgRNA enrichment in CHK1i-positive selection screen in A549 (C) and NCI-H460 (D) cells.
(E) Viability curves of A549 cells expressing sgRNAs in the presence of increasing CHK1i concentrations for 72 h. n = 3.
(F) Immunoblot of MMB-FOXM1 components in A549 LIN54 KO and FOXM1 KO cells lines.
(G) A 10-day growth curve and doubling time of A549 EV, LIN54 KO, and FOXM1 KO cells. n = 3.
(H) Viability curves of A549 EV, LIN54 KO, and FOXM1 KO cells in the presence of increasing CHK1i concentrations for 72 h. n = 3.
Mean ± SD.
