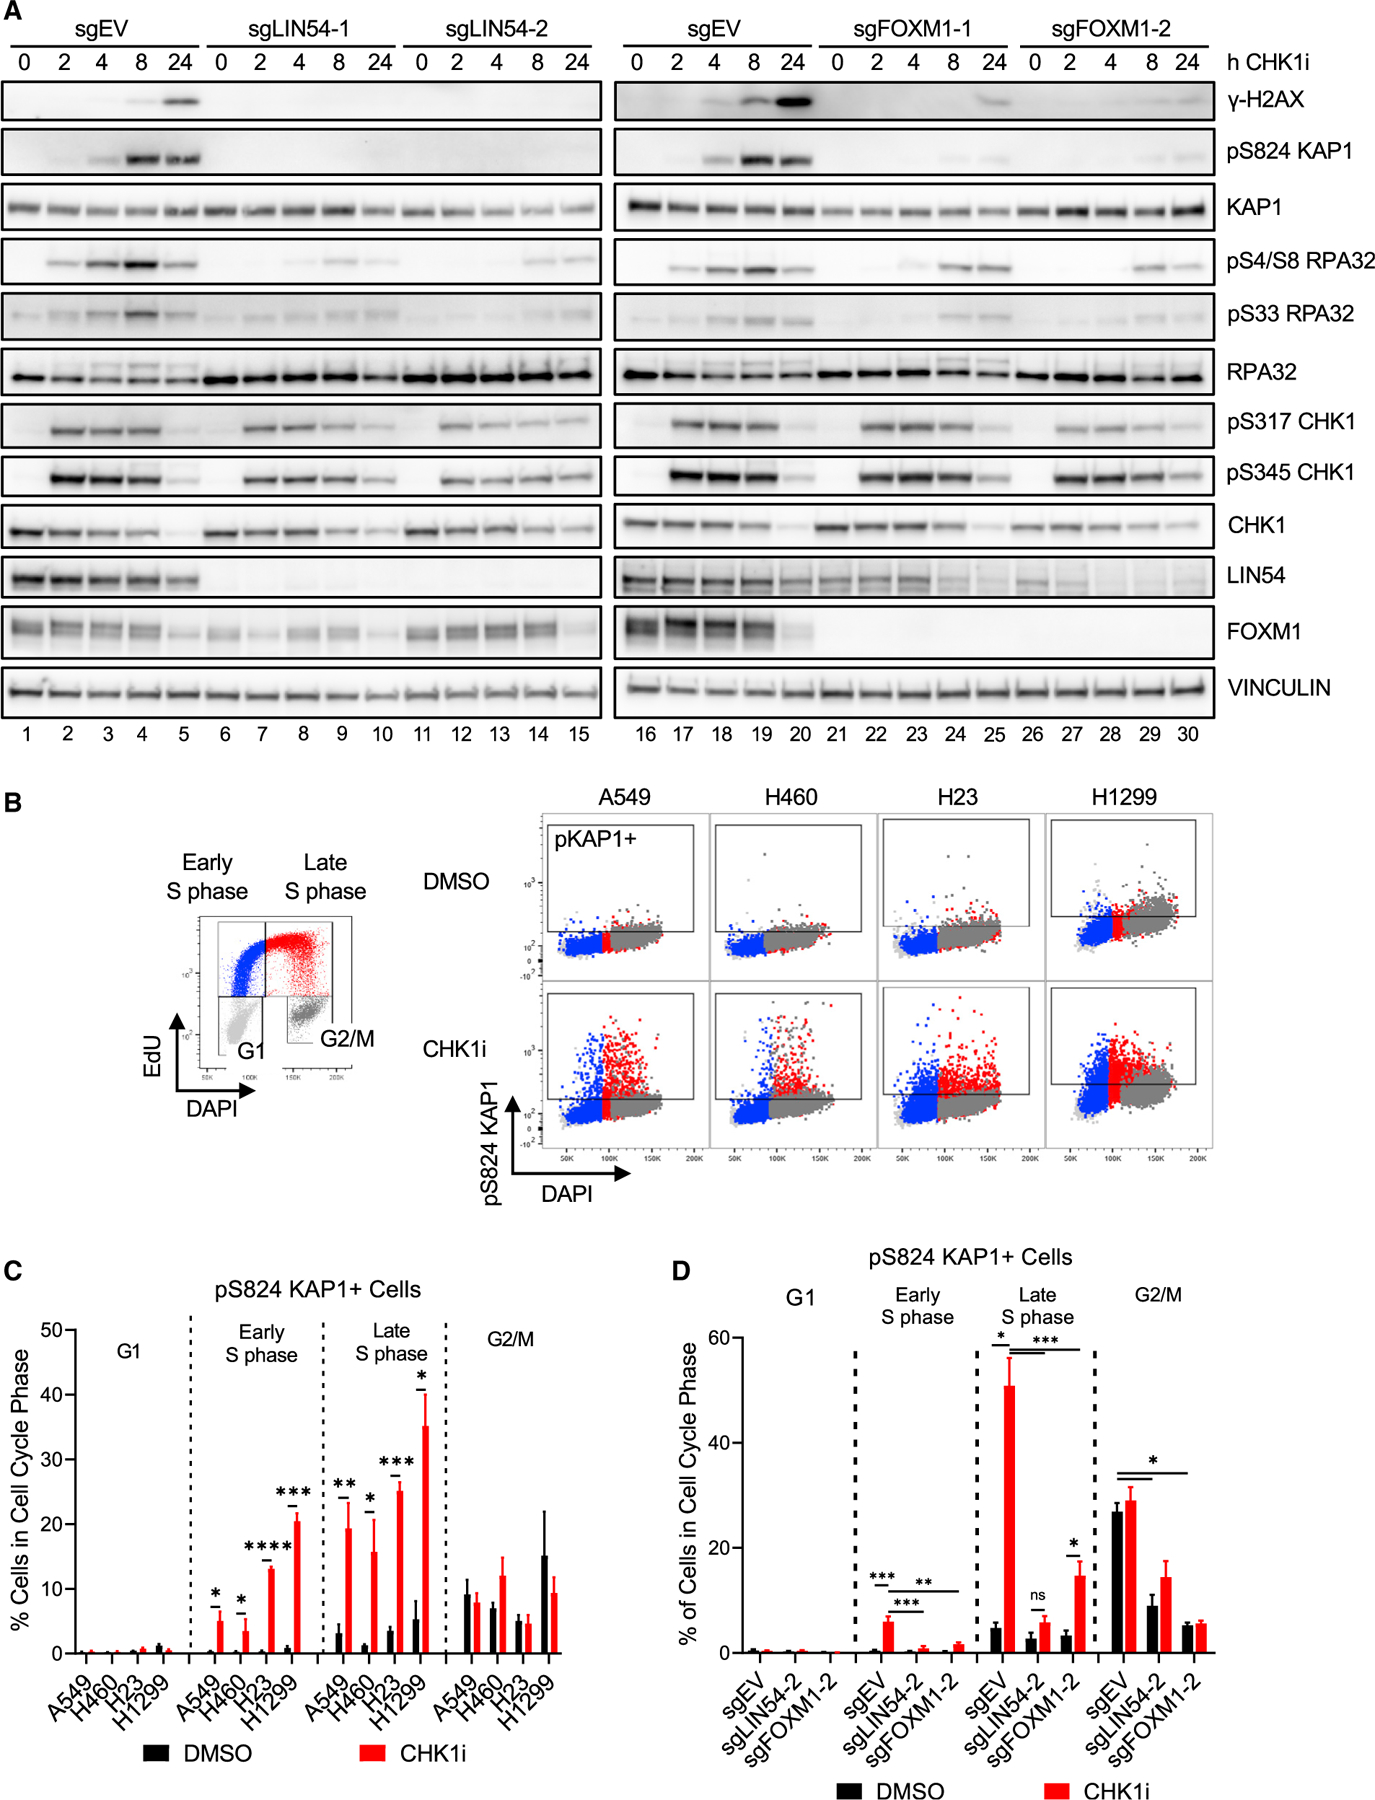
Figure 2. Loss of MMB-FOXM1 complex components reduces replication stress markers during Late S phase.

(A) Immunoblot of replication stress markers in EV, LIN54 KO, and FOXM1 KO A549 cells treated with 100 nM CHK1i over a 24-h time course.
(B–D) Flow cytometry to assess pKAP1 levels in different cell cycle phases.
(B) NSCLC cells were treated with DMSO or 100 nM CHK1i for 2 h and pulsed with 10 μM EdU for the last hour. pKAP1 versus DNA content with cell cycle populations denoted by the colors in the legend. Box denotes the gate for pKAP1-positive cells.
(C) Quantification of (B), with replicates. n = 3.
(D) EV, LIN54 KO, and FOXM1 KO cells were treated and labeled as in (B). pKAP1-positive cells in each cell cycle phase. n = 3.
Mean ± SEM; ANOVA with Tukey correction; *p < 0.05; **p < 0.01; ***p < 0.001.
