
Figure 3. Induction of pKAP1 by CHK1i during Late S phase is ATR dependent.
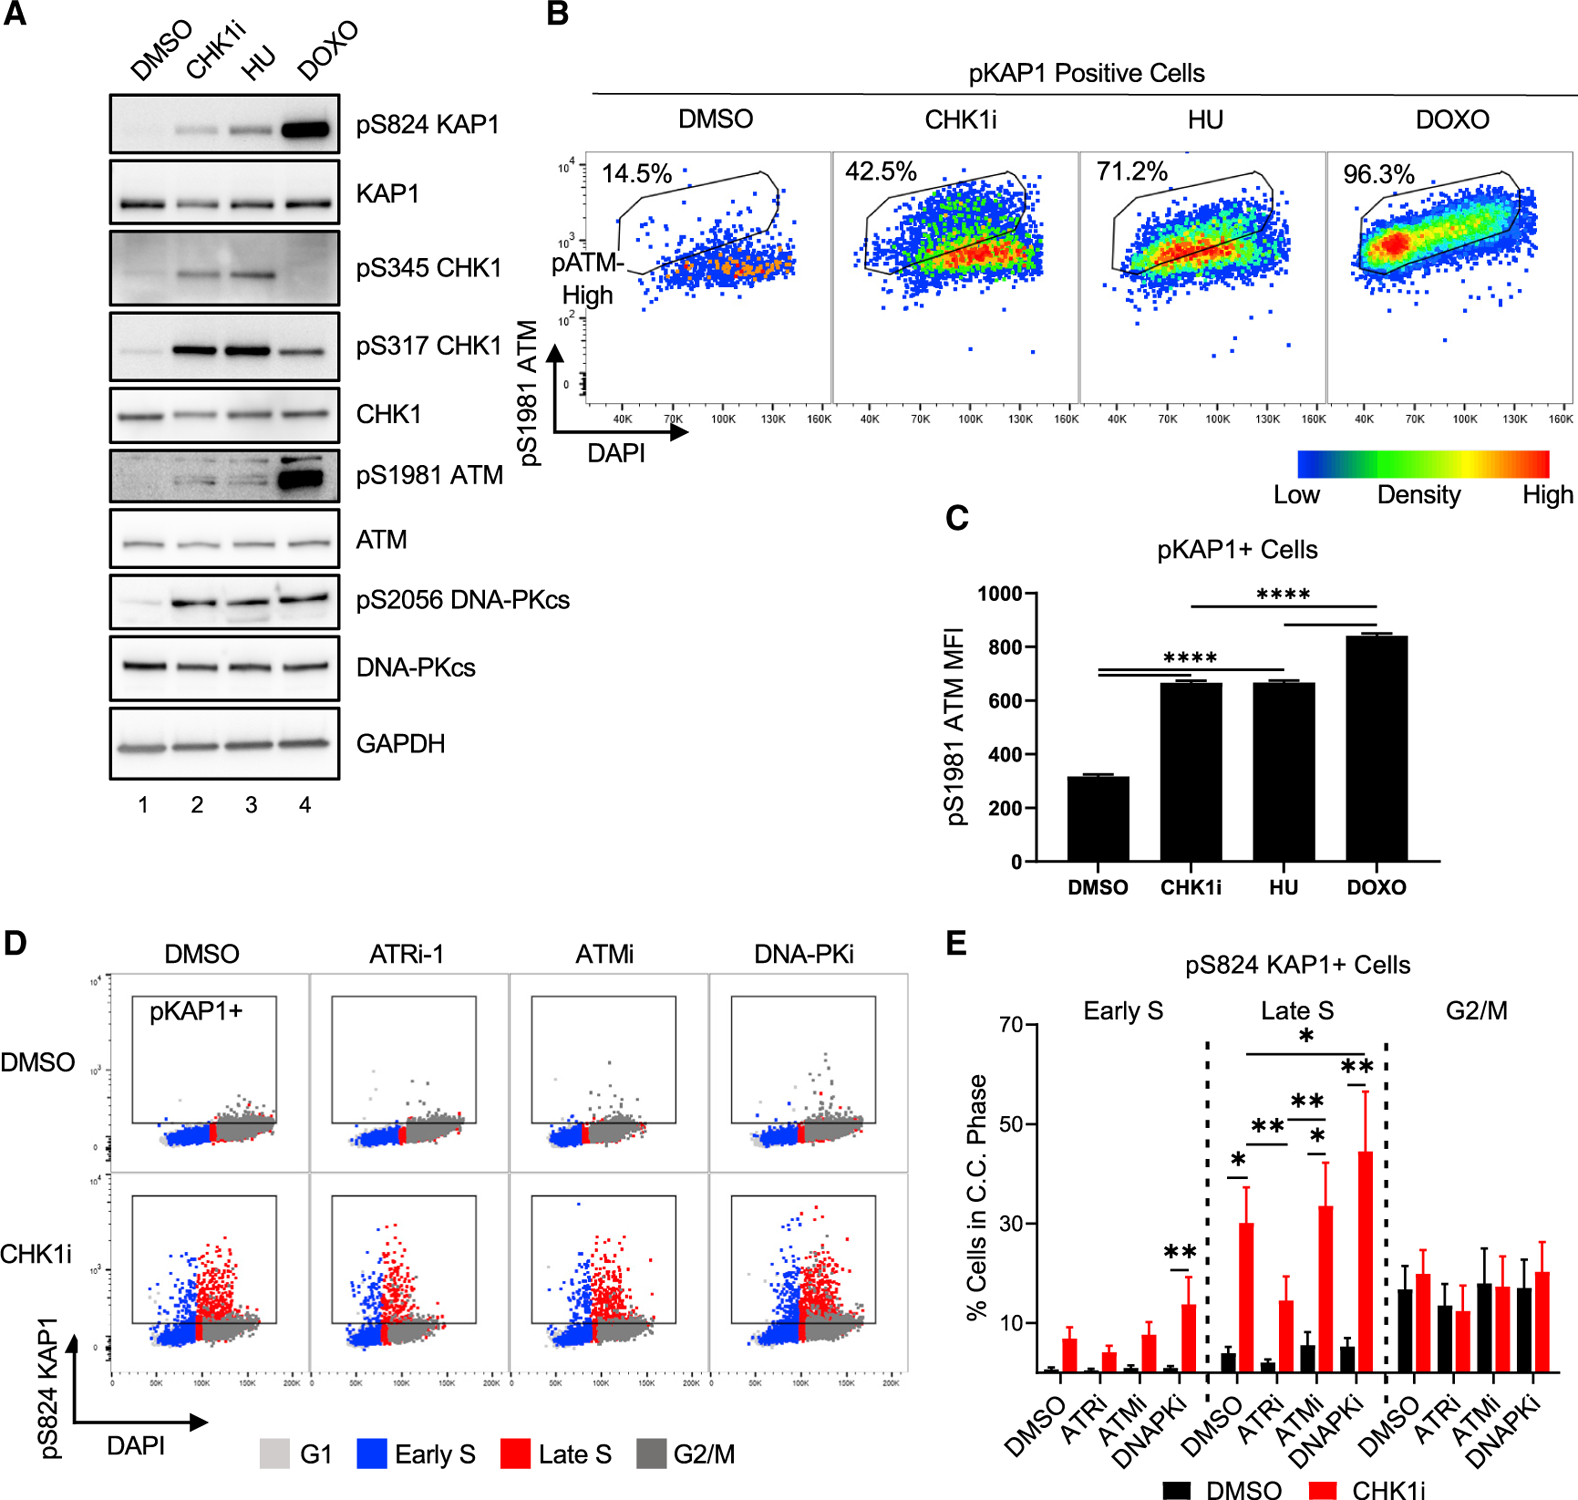
(A) Immunoblot of replication stress markers in A549 cells treated with 100 nM CHK1i, 2 mM HU, or 500 nM DOXO for 2 h.
(B and C) Flow cytometry to assess ATM activity and pKAP1 levels in cells treated as in (A) and pulsed with 10 μM EdU for the last hour.
(B) Density dot plot of pS1981 ATM levels versus DAPI stain of pKAP1-positive cells. Box denotes pS1981 ATM high based on the DOXO-treated sample.
(C) pS1981 ATM mean fluorescence intensity (MFI) in pKAP1-positive cells identified in Figure S3B. n = 4.
(D and E) Flow cytometry of pKAP1 levels after treatment as in Figure 2B ± ATRi, ATMi, or DNA-PKi. (D) pKAP1 versus DAPI levels with cell cycle phases overlaid in the colors denoted in the legend. Box denotes the pKAP1-positive population.
(E) Quantification of (D), with replicates. n = 5. ANOVA-mixed effects analysis with Tukey correction.
Mean ± SEM; ANOVA with Tukey correction; *p < 0.05; **p < 0.01; ***p < 0.001.