
Figure 4. CHK1i increases DNA replication regardless of the loss of LIN54 or FOXM1.
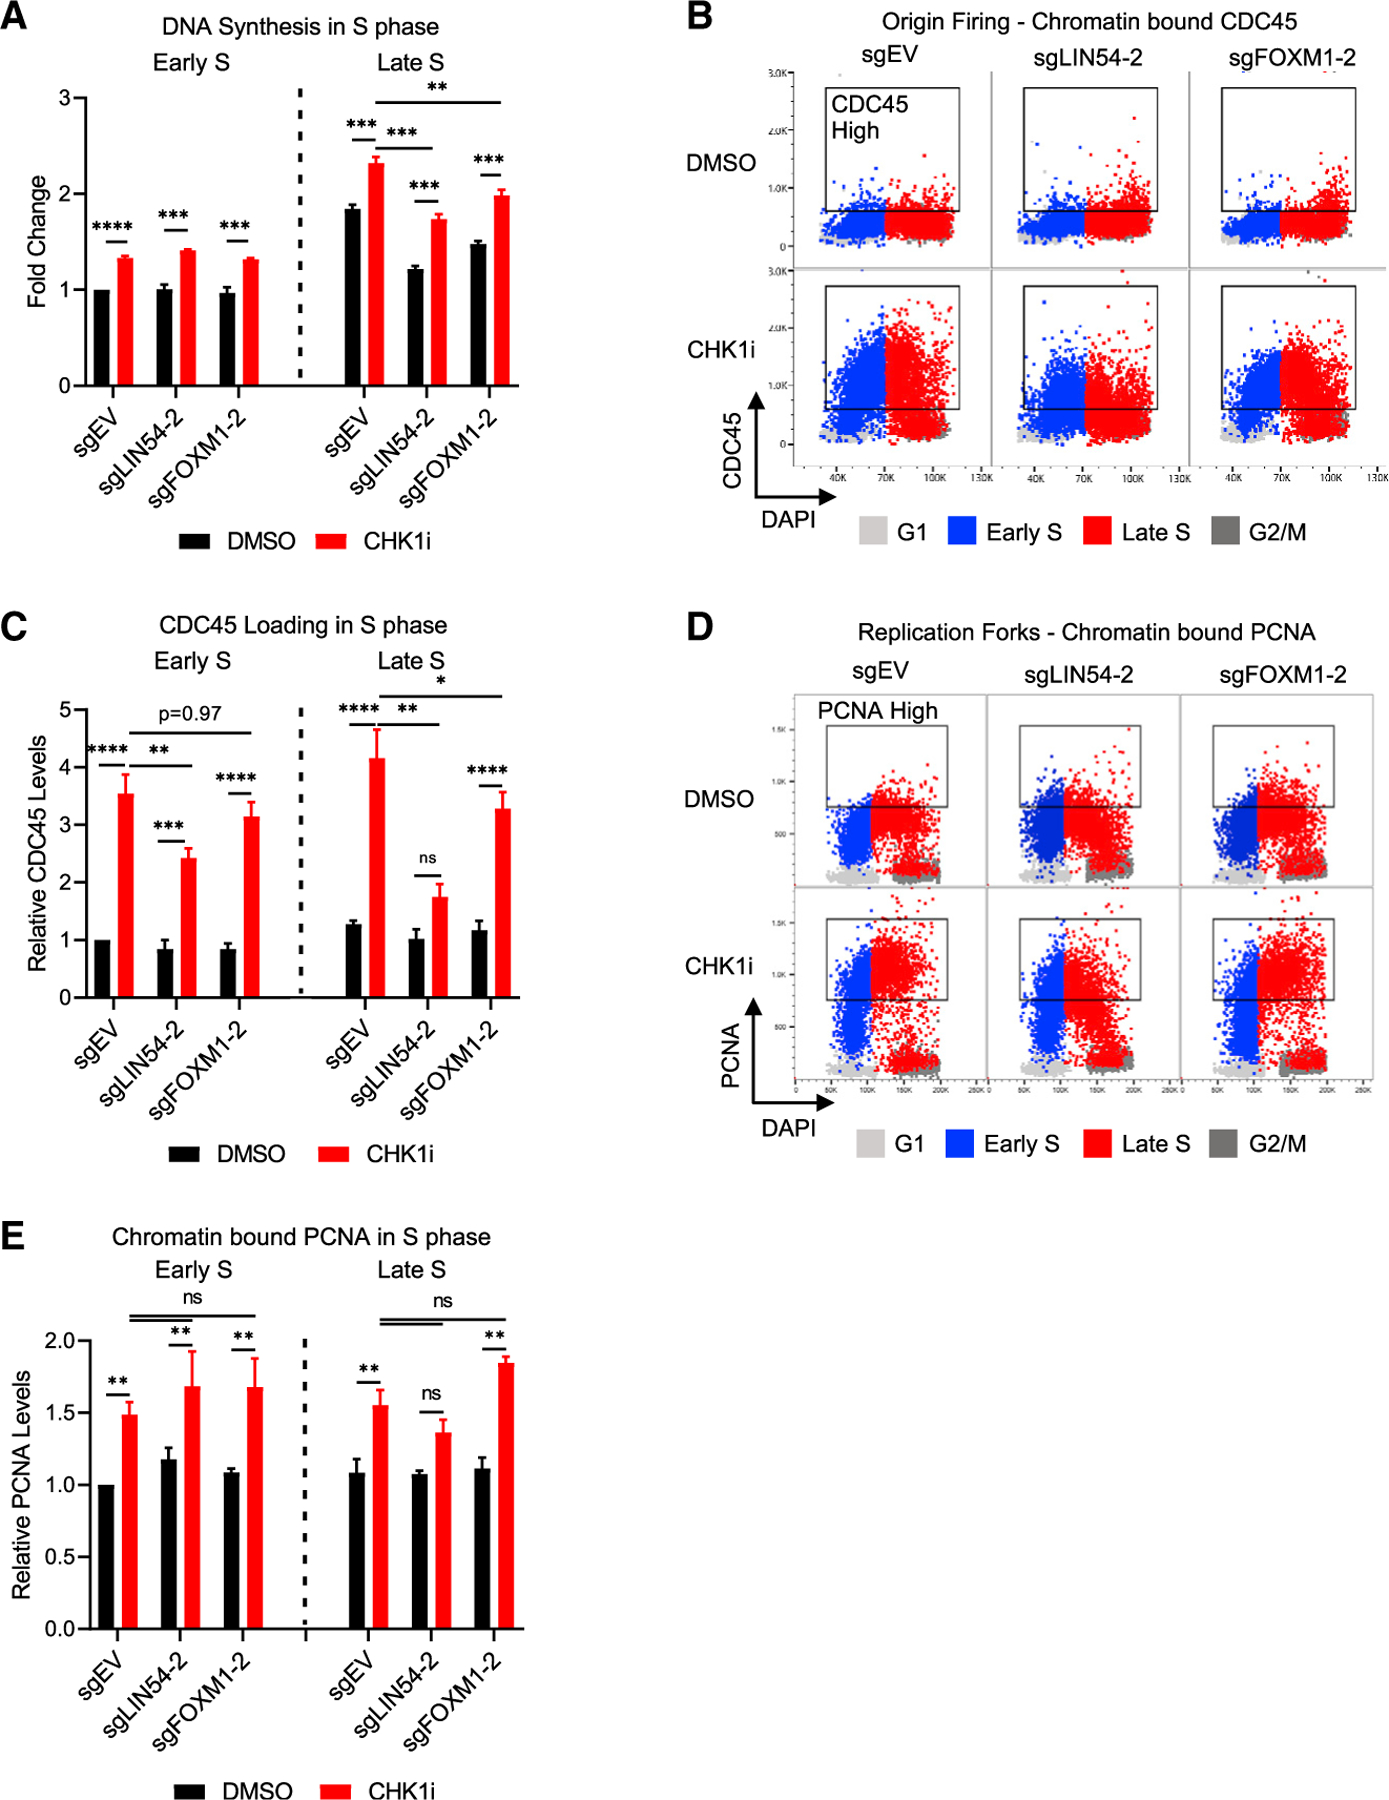
(A) Relative EdU incorporation in Early S and Late S phase in LIN54 or FOXM1 KO cells after CHK1 inhibition. MFI of S phase populations per gates in Figure S2A were normalized to EV DMSO Early S populations. n = 3.
(B and C) Chromatin flow cytometry for chromatin-bound CDC45.
(B) CDC45 versus DAPI levels with cell cycle phases overlaid in the colors denoted. Box denotes >98th percentile of CDC45 in the sgEV-DMSO sample.
(C) MFI of CDC45 in Early and Late S phase. n = 3.
(D and E) Chromatin flow cytometry for chromatin-bound PCNA.
(D) PCNA versus DAPI levels with cell cycle phases overlaid in the colors denoted. Box denotes >98th percentile of PCNA in the sgEV-DMSO sample.
(E) MFI of PCNA in Early and Late S phase. n = 3. Mean ± SEM; ANOVA with Tukey correction; *p < 0.05; **p < 0.01; ***p < 0.001.