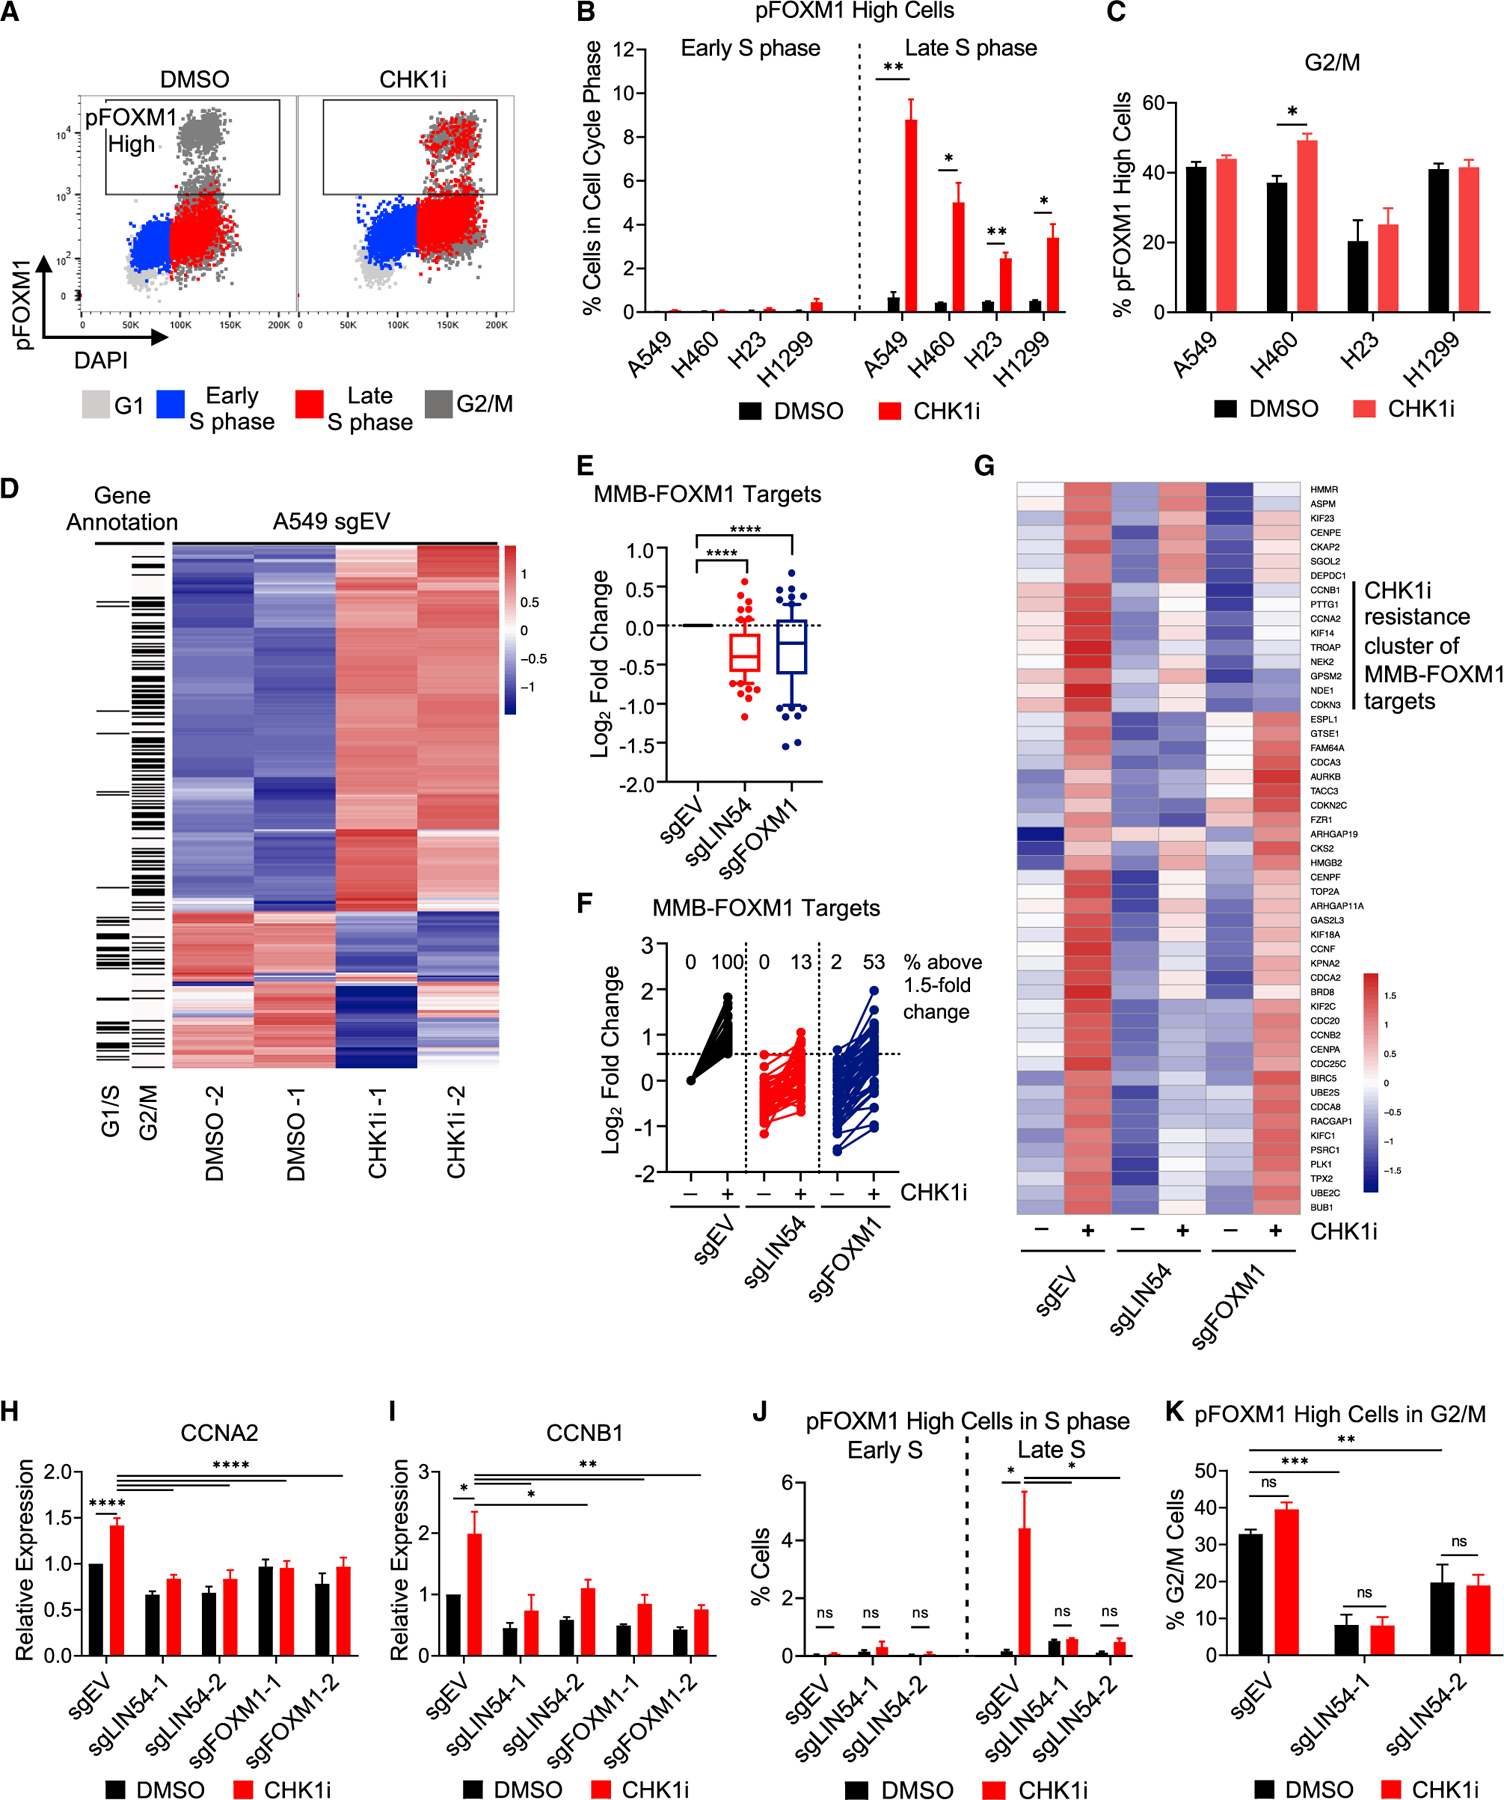
Figure 5. Activation of G2/M genes after CHK1i is MMB-FOXM1 dependent.

(A–C) pFOXM1 levels in NSCLC cell lines after CHK1i. Cells were treated as in Figure 2B.
(A) pFOXM1 versus DAPI levels with cell cycle phase overlaid in the colors denoted. Box denotes high pT600 FOXM1 levels found in G2/M cells of the DMSO sample.
(B and C) Percentage of pFOXM1-High cells in Early and Late S phase (B) and G2/M (C). n = 4.
(D–G) Gene expression during S phase. EV, LIN54 KO, and FOXM1 KO cells were synchronized by single thymidine block. Samples were treated with DMSO or 100 nM CHK1i at 1 h post-release and samples were collected at 3 h post-release. Total RNA was extracted and sequenced.
(D) Heatmap showing the 350 most differentially expressed genes in EV cells between the DMSO- and CHK1-treated samples.
(E) Expression of MMB-FOXM1 target genes in relation to EV cells. Log2 fold change calculated using DESeq2.
(F and G) Expression of MMB-FOXM1 target genes upregulated in EV cells after CHK1i by ≥1.5-fold change (51 genes), depicted as log2 fold change determined in relation to EV DMSO-treated cells, with % of genes upregulated above 1.5-fold change in each sample reported (F), and as a heatmap (G).
(H and I) qRT-PCR of MMB-FOXM1 target genes CCNA2 (H) and CCNB1 (I) during S phase in EV, LIN54 KO, and FOXM1 KO cells after CHK1 inhibition. Samples were synchronized, treated, and collected as in (D)–(G). n = 3.
(J and K) pFOXM1 levels in LIN54 KO cells. EV or LIN54 KO cells were treated as in Figure 2B. Samples were stained for pFOXM1, EdU, and DAPI. Percentage of pFOXM1-High cells in Early and Late S phase (J) and G2/M. (K) n = 4.
Mean ± SEM; ANOVA with Tukey correction; *p < 0.05; **p < 0.01; ***p < 0.001; ****p < 0.0001.
