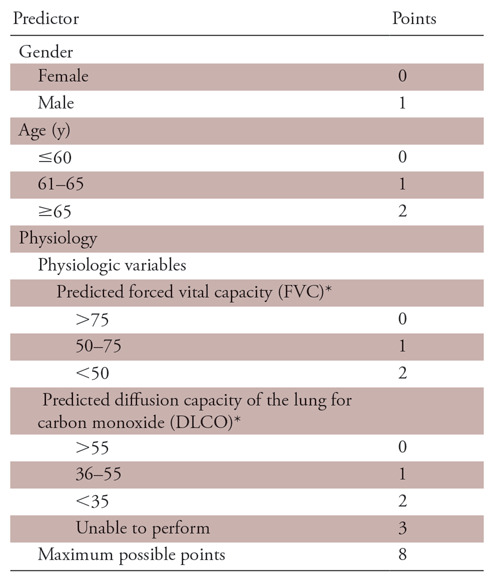
Table 1:
Gender, Age, and Physiology (GAP) Score

Note.—Score of 0–3 indicates GAP stage I, score of 4–5 indicates GAP stage II, and score of 6–8 indicates GAP stage III.
*Indicates percentage predicted.
Gender, Age, and Physiology (GAP) Score

Note.—Score of 0–3 indicates GAP stage I, score of 4–5 indicates GAP stage II, and score of 6–8 indicates GAP stage III.
*Indicates percentage predicted.