
Table 2:
Baseline Study Characteristics
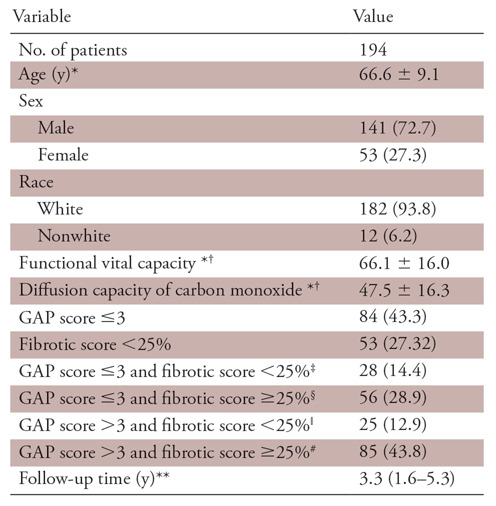
Note.—Unless otherwise specified, data are frequencies, with percentages in parentheses. GAP = gender, age, and physiology.
*Data are means ± standard deviation.
†Indicates percentage predicted.
‡Indicates group A1.
§Indicates group B1.
ǁIndicates group A2.
#Indicates group B2.
**Data are medians, with interquartile range in parentheses.