FIGURE 4.
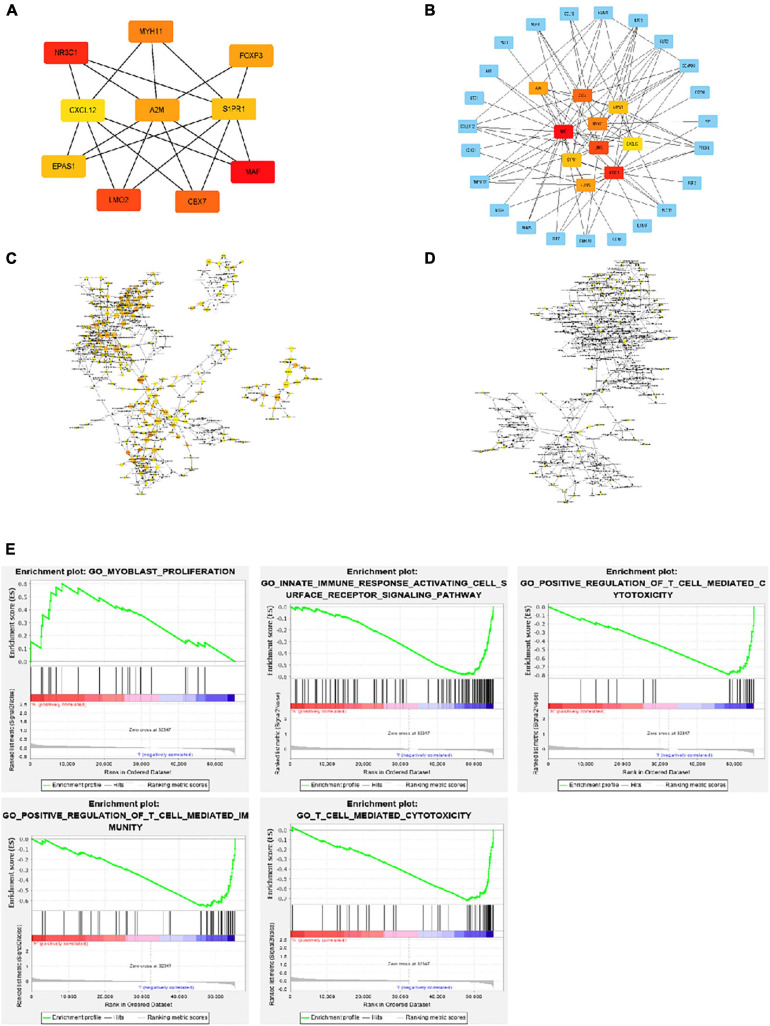
Interaction network and biological process analysis of the hub genes. (A) Top 10 hub genes screened from the regulatory network. (B) Top 10 hub genes and their first neighbors that are screened from the regulatory network. Hub gene is shown in red to orange on the left. The first neighboring node is shown in blue. The right picture shows the characteristics of the genes in the left picture. The green ones are low-risk genes. The red ones are high-risk genes. The triangles are transcription factors. (C) The biological process analysis of genes in the network was constructed using BiNGO. The color depth of nodes refers to the corrected P value of ontologies. The size of nodes refers to the number of genes that are involved in the ontologies. P < 0.01 was considered statistically significant. (D) The biological process analysis of hub genes was constructed using BiNGO. P < 0.05 was considered statistically significant. (E) Ten-hub-gene enrichment plots from Gene Set Enrichment Analysis (GSEA).

